Dashboard
What you will find here
- topic trends over time: how themes emerge, peak, and fade
- sentiment & toxicity dynamics: how emotions and tone shift
- polarization indicators: when and where conversations diverge
The analysis is powered by MUSMA models, designed to process millions of posts and reveal patterns that are invisible at smaller scales.
All information is based on the following publications [Storani25][Loru25]. All code is openly available at the project’s GitHub repository.
Quick data statistics
21M
total posts
12M
from Twitter/X
8M
from Facebook
650k
from Instagram
38k
from YouTube
_
Posted between 01/01/2018 and 31/12/2022
Talking about: climate change
(Posts are analyzed in aggregate to capture global trends rather than individual behavior)
Topic clustering
This section maps the semantic structure of climate-related discussions by grouping posts into coherent topic clusters.
Using representation learning and clustering techniques, each post is embedded in a semantic space and grouped based on similarity of content, revealing major themes and sub-discourses within the conversation.
How to read the plot
- Each point represents a post
- Distance reflects semantic similarity (closer = more similar content)
- Colors indicate automatically identified topic clusters
- The 2D layout is a projection of a higher-dimensional semantic space
Clusters do not overlap conceptually, but may appear close in the projection due to dimensionality reduction.
What this view reveals
- Core vs peripheral topics
Dense central regions correspond to high-volume, general discussions, while smaller, isolated clusters capture more specific or niche themes. - Topical diversity
The presence of many medium-sized clusters highlights the fragmentation of climate discourse into multiple concurrent narratives. - Bridging topics
Clusters positioned between others often act as semantic connectors, linking activism, policy, science, and news-oriented discussions.
⚠️ Interpretation note
Cluster labels and boundaries are data-driven and approximate. This visualization is intended to support exploration and comparison, not strict topic taxonomy.
Sentiment over time
How does the tone of the conversation change across platforms?
This heatmap shows the evolution of public sentiment over time for each social media platform. It highlights periods of heightened negativity or positivity, as well as platform-specific dynamics that may reflect differences in audience, moderation, or communication style.
How to read it
- Color: average sentiment level (🔵 blue for positive, 🟡 yellow for neutral, 🔴 red for negative)
- X-axis: time
- Y-axis: social media platform
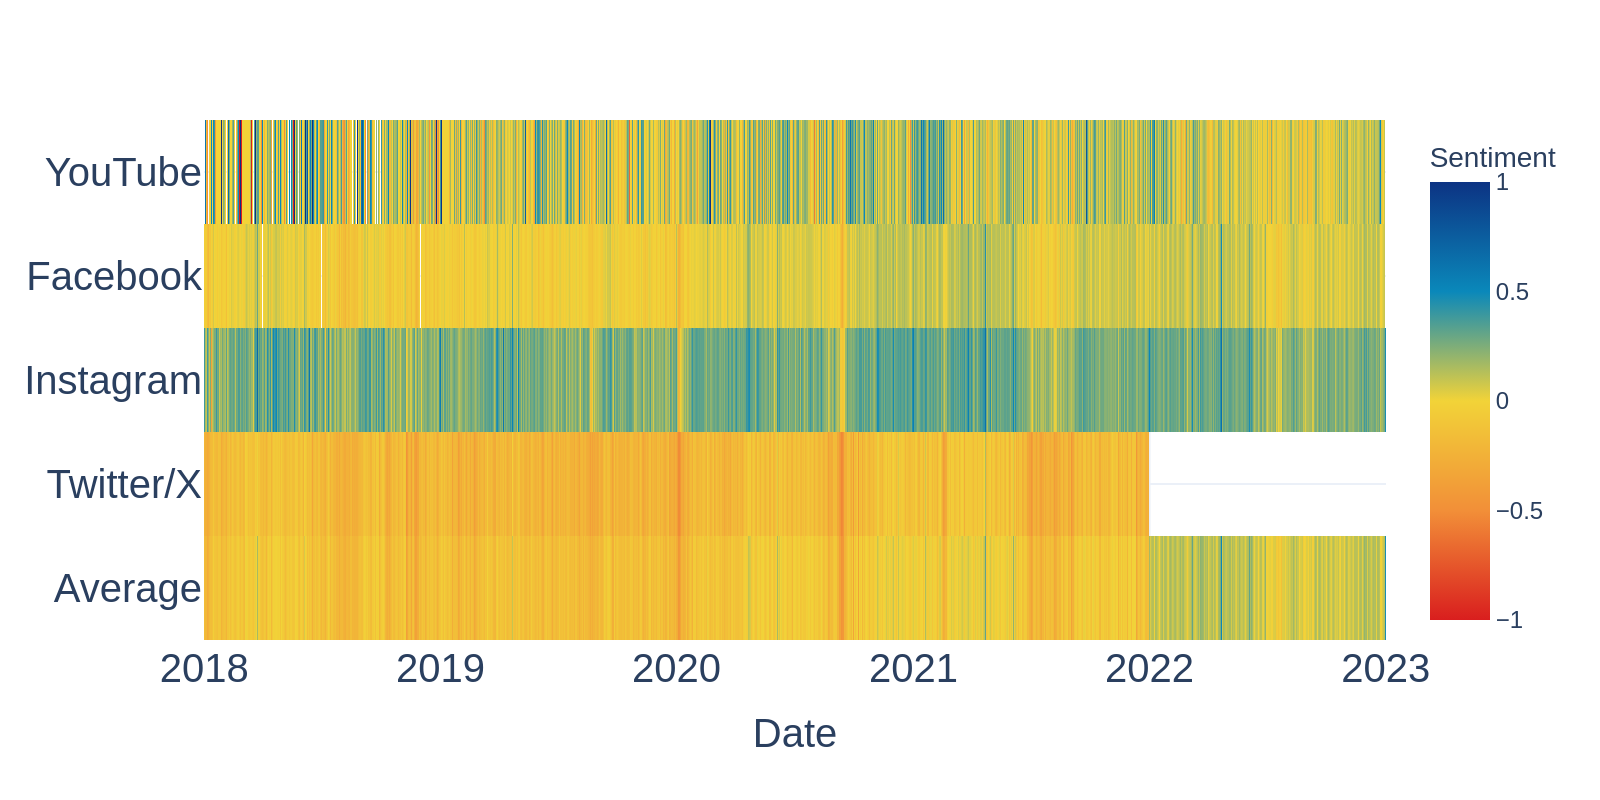
What stands out
- Platform-specific tone differences
Instagram conversations are consistently more 🔵 positive than other platforms, while X (Twitter) shows a more 🔴 negative and volatile tone over time. - Temporal fluctuations align across platforms
Several sentiment shifts occur simultaneously across platforms, suggesting reactions to shared external events (e.g. policy announcements, climate reports, global crises). - Data availability matters
The absence of Twitter data starting from 2022 reflects collection or access limitations, not a change in sentiment. This highlights how platform policies can shape what can be analyzed.
⚠️ Note: Sentiment values reflect aggregate trends, not individual opinions. Differences across platforms may arise from audience composition, moderation practices, and posting behavior, in addition to the underlying public discourse.
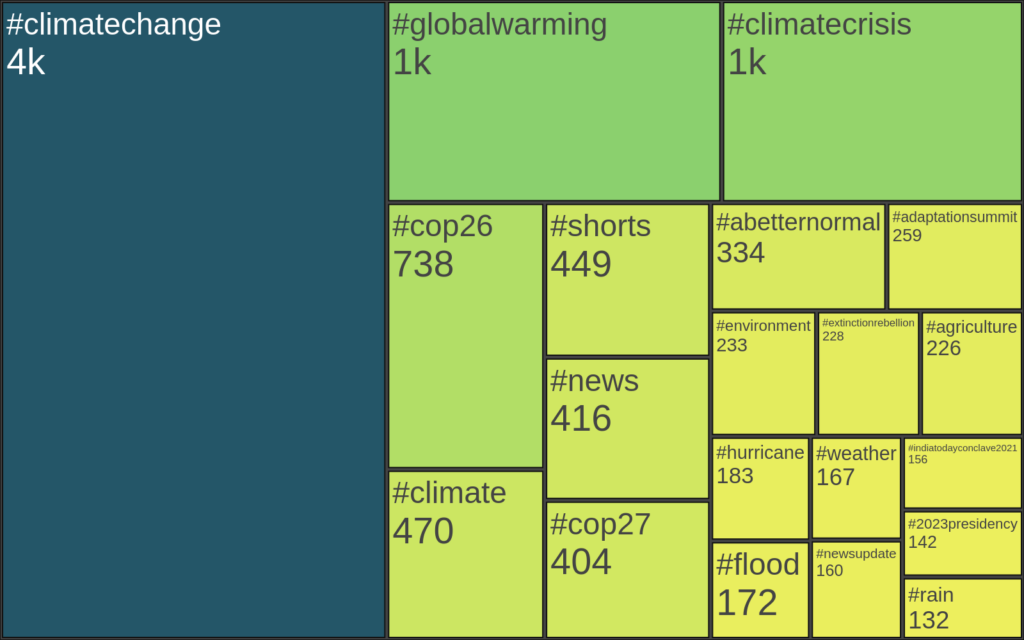
The discourse in hashtags
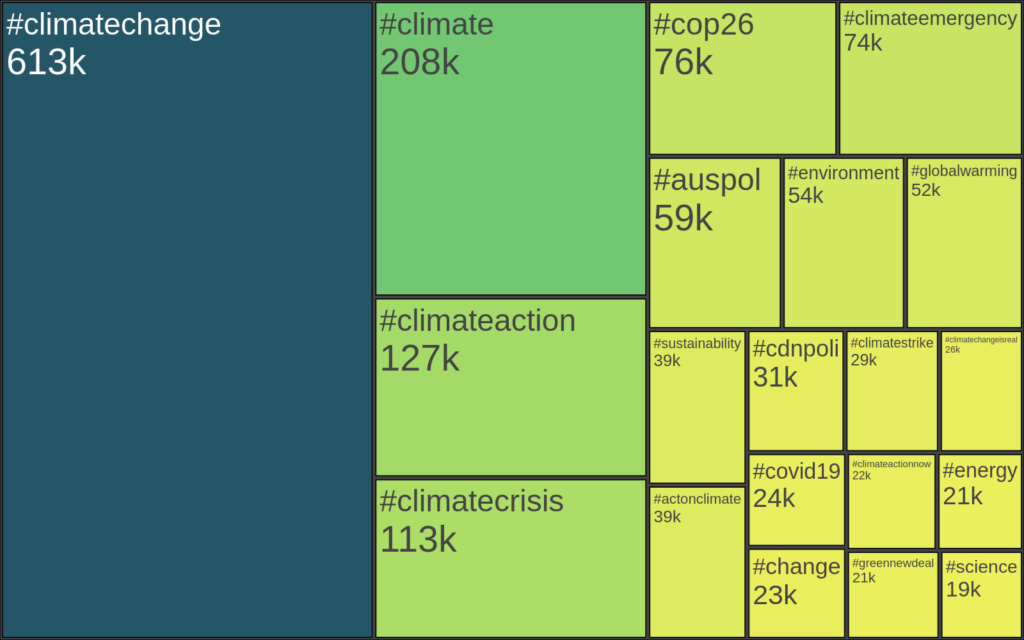
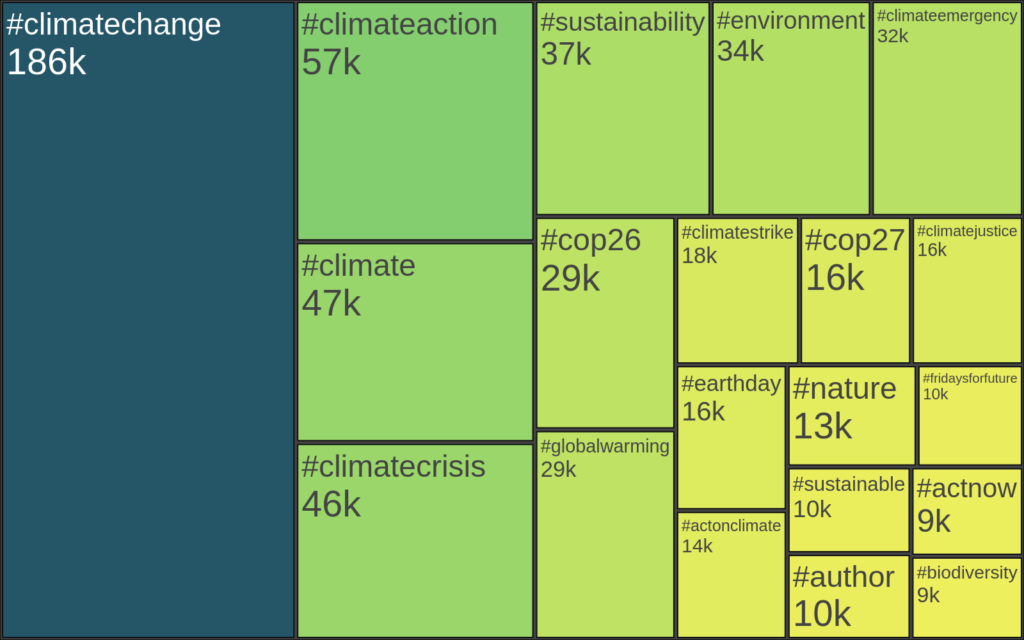
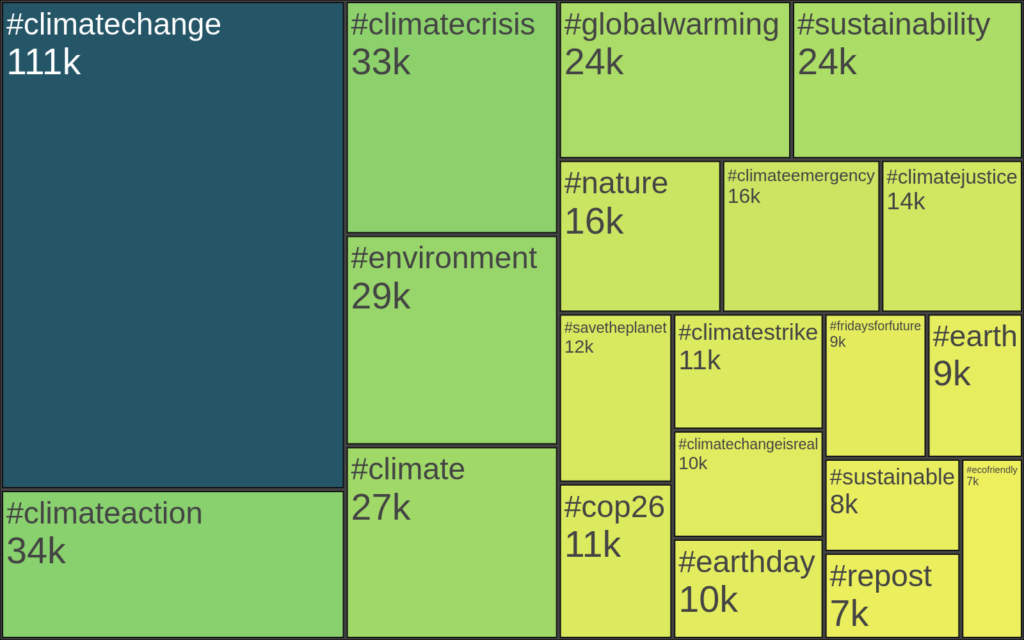
This section highlights the most frequent hashtags used in climate-related conversations across social media platforms.
The treemaps below emphasize both dominant narratives and platform-specific framing.
How to read it
- Box size reflects hashtag frequency
- Color intensity reinforces relative prominence
- Each treemap is platform-specific
(Instagram, YouTube, Twitter, Facebook)
Twitter/X
YouTube
Global
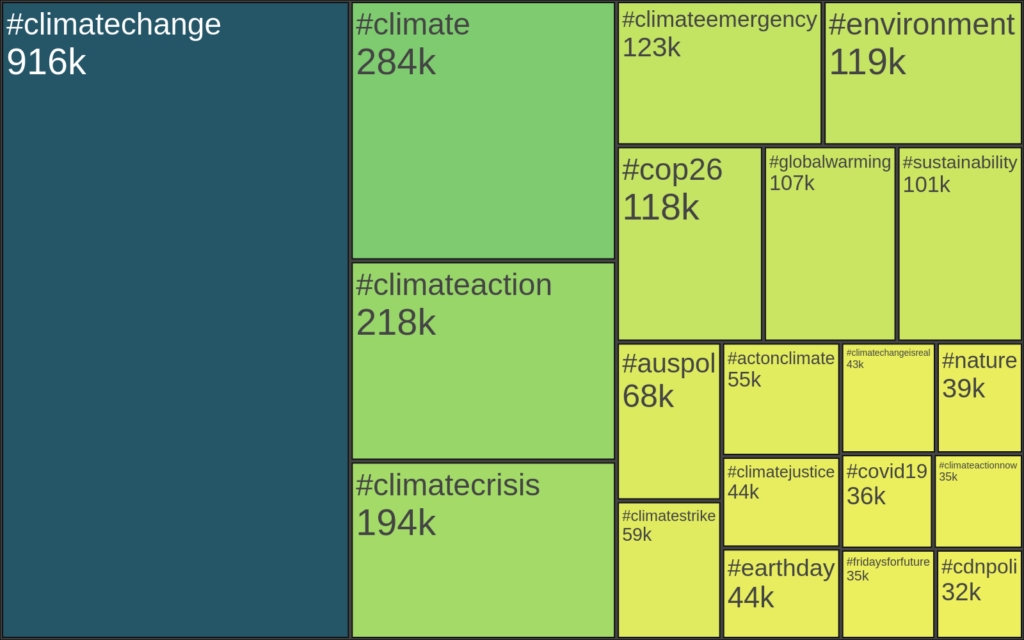
Key observations
- Different modes of engagement
Facebook shows a more institutional and informational framing, whereas Twitter exhibits higher fragmentation and political signaling. - A shared core vocabulary
Hashtags like #climatechange, #climate, and #climateaction dominate across all platforms, indicating a common baseline discourse. - Platform-specific emphases
Instagram foregrounds activism and lifestyle themes (e.g. #sustainability, #earthday), while YouTube and Twitter surface more event-driven and news-oriented hashtags (e.g. #COP26, #news).
Hashtags and reliability
By comparing the hashtags used in posts linking to reliable and unreliable sources, we can observe how different narratives emerge within the climate change debate.
For each platform, we identified the most frequently used hashtags and compared their relative frequency in posts sharing reliable versus unreliable content. The figures below show the difference in usage for the most common hashtags appearing in posts from 🔴 unreliable and 🔵 reliable sources.
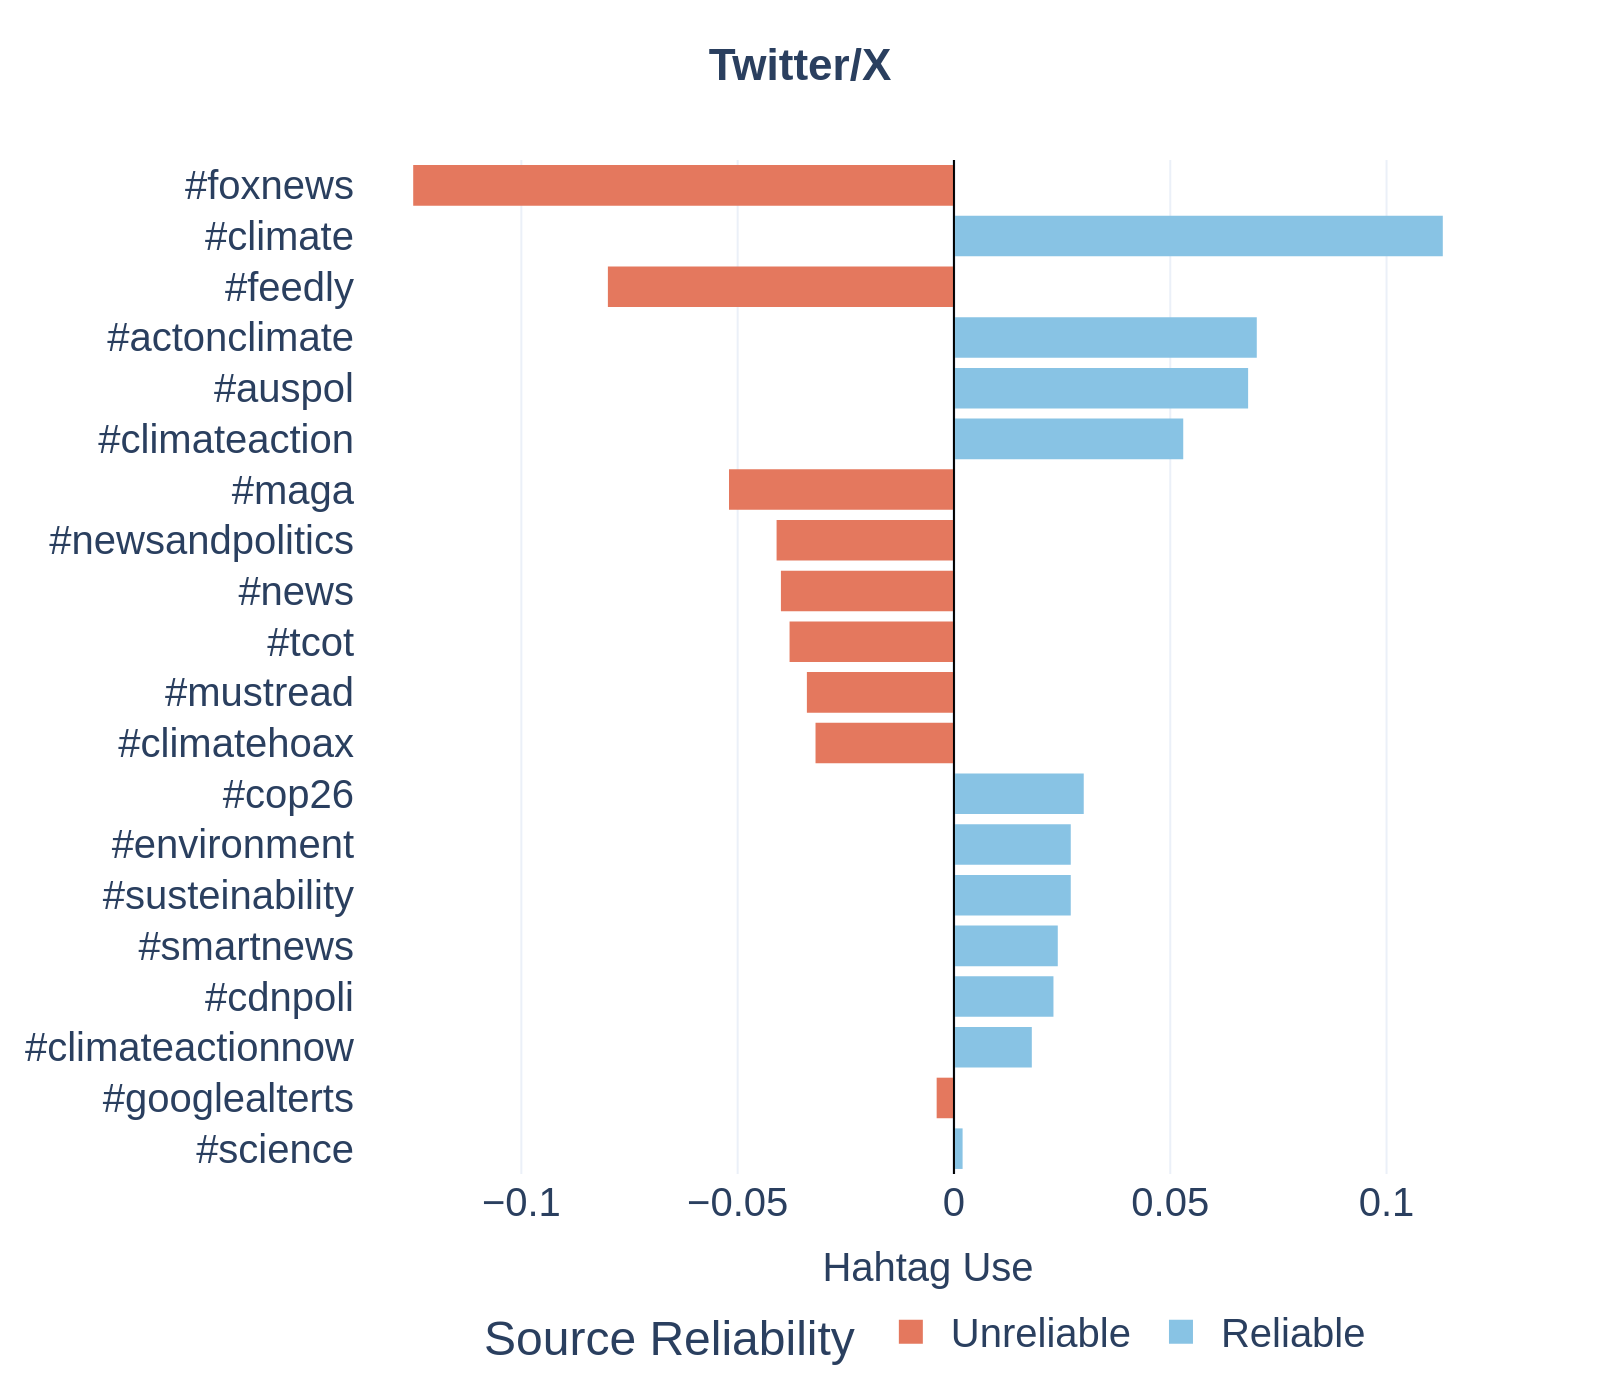
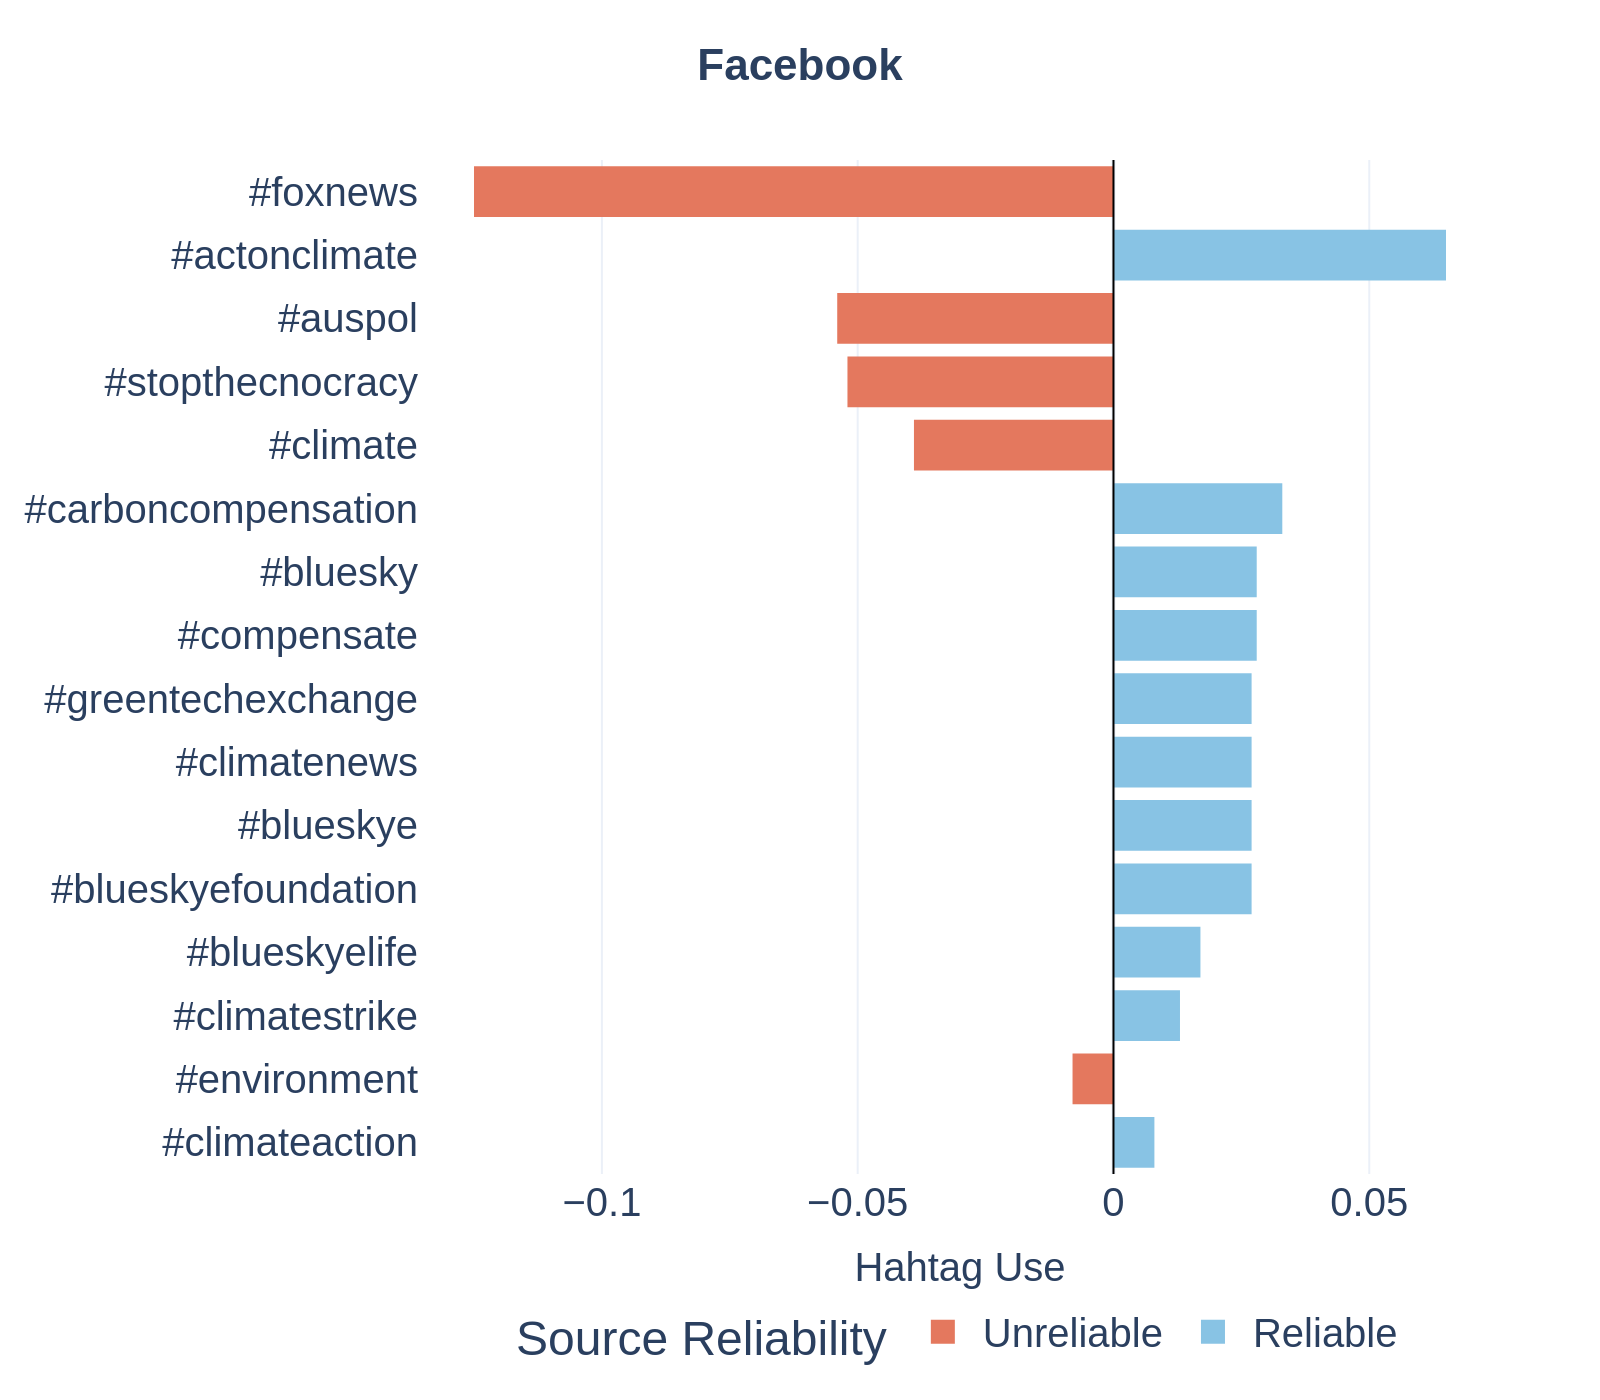
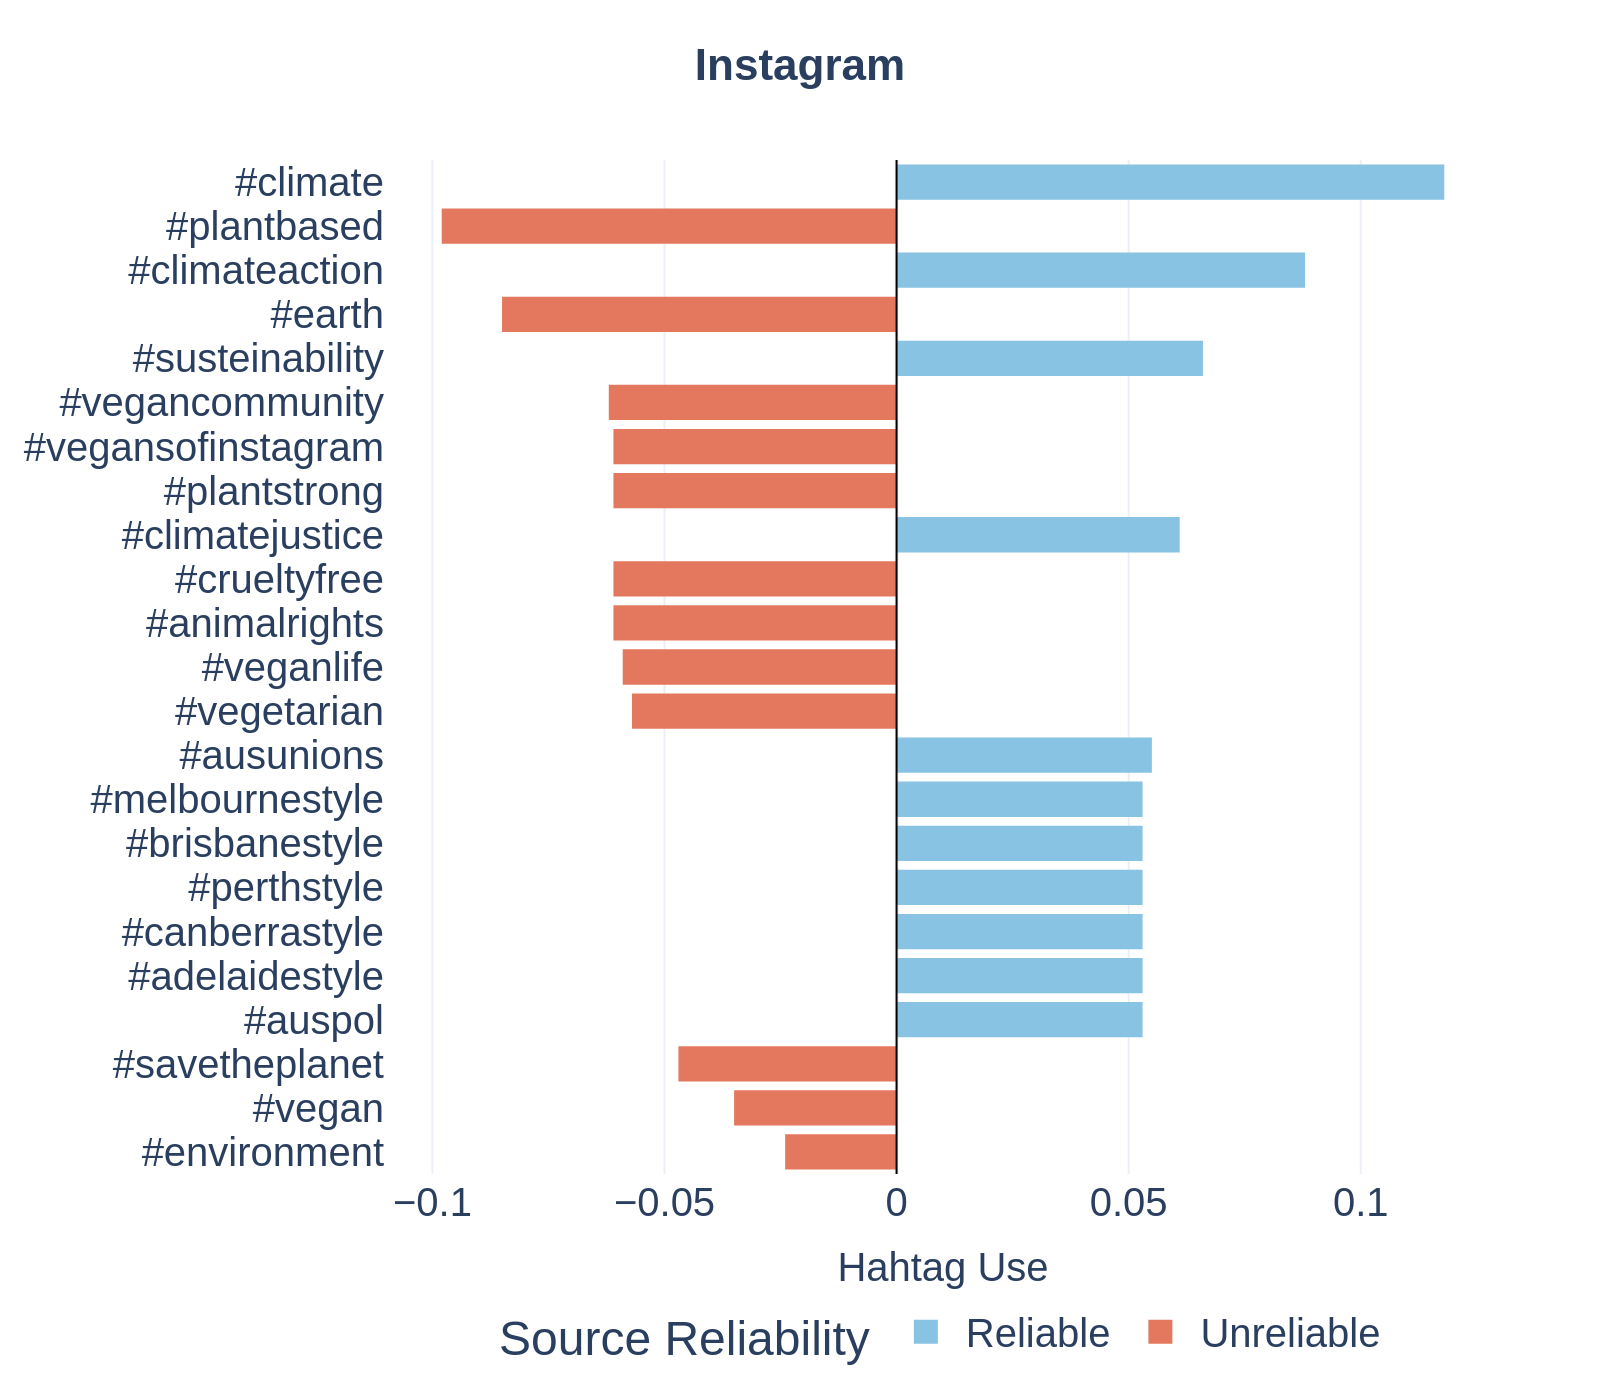
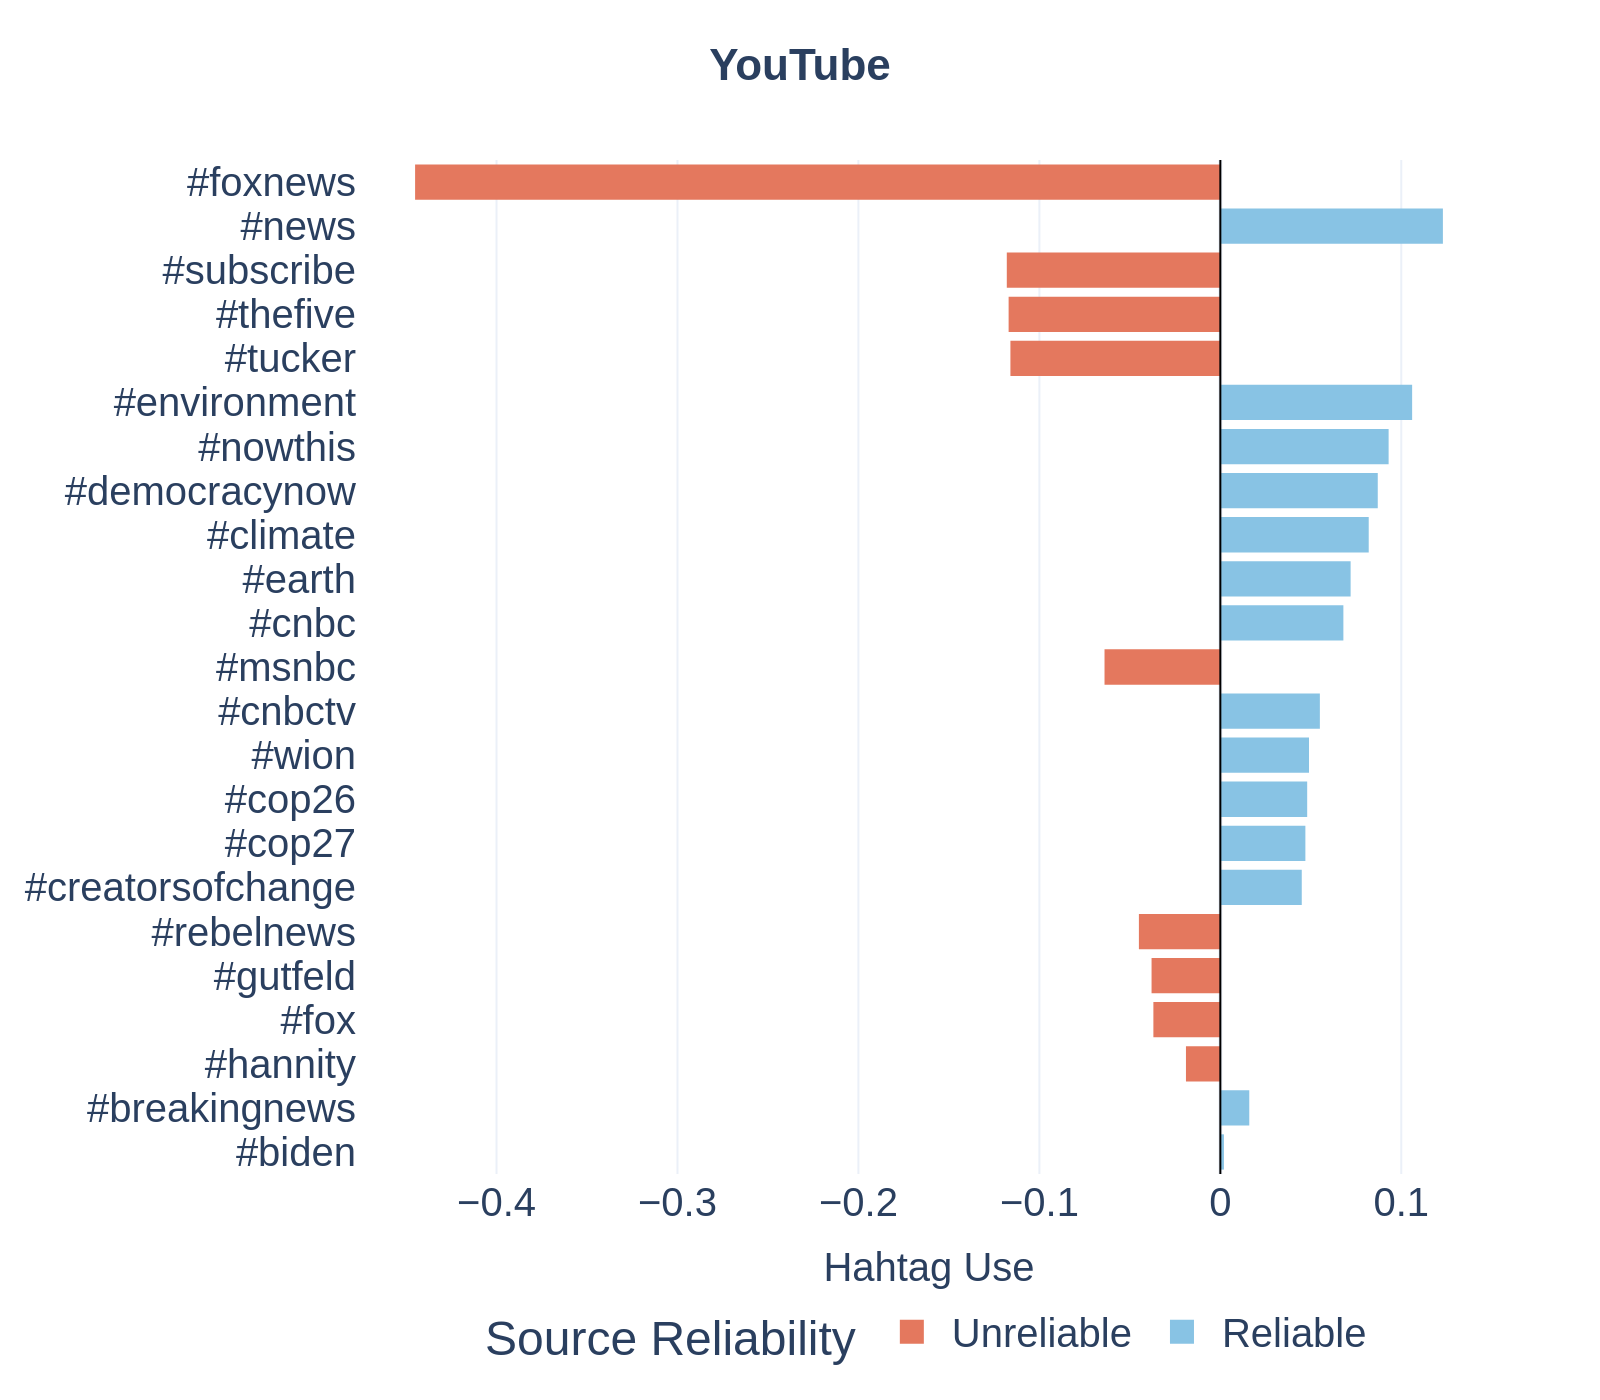
Key observations
The analysis highlights clear differences in how climate-related discussions are framed:
- Reliable sources tend to use hashtags connected to scientific discussions and international policy events, such as
#cop26, #cop27, and #actionclimate. - Unreliable sources more frequently employ hashtags associated with controversial or sceptical narratives, including terms such as #climatehoax.
Platform-specific dynamics
While most platforms show similar patterns, Instagram displays a slightly different structure, where some hashtags associated with unreliable content overlap with lifestyle or community-driven discussions (e.g., vegan or environmental communities). Meanwhile, hashtags used in reliable posts sometimes include geographically specific references, indicating links to regional climate initiatives or local discussions.
A polarized vocabulary
Overall, the differences in hashtag usage reveal a diverging vocabulary between the two groups. Posts linking to unreliable sources tend to employ hashtags that question or challenge the scientific consensus on climate change, while posts linking to reliable sources more often emphasize scientific evidence, policy discussions, and collective climate action.
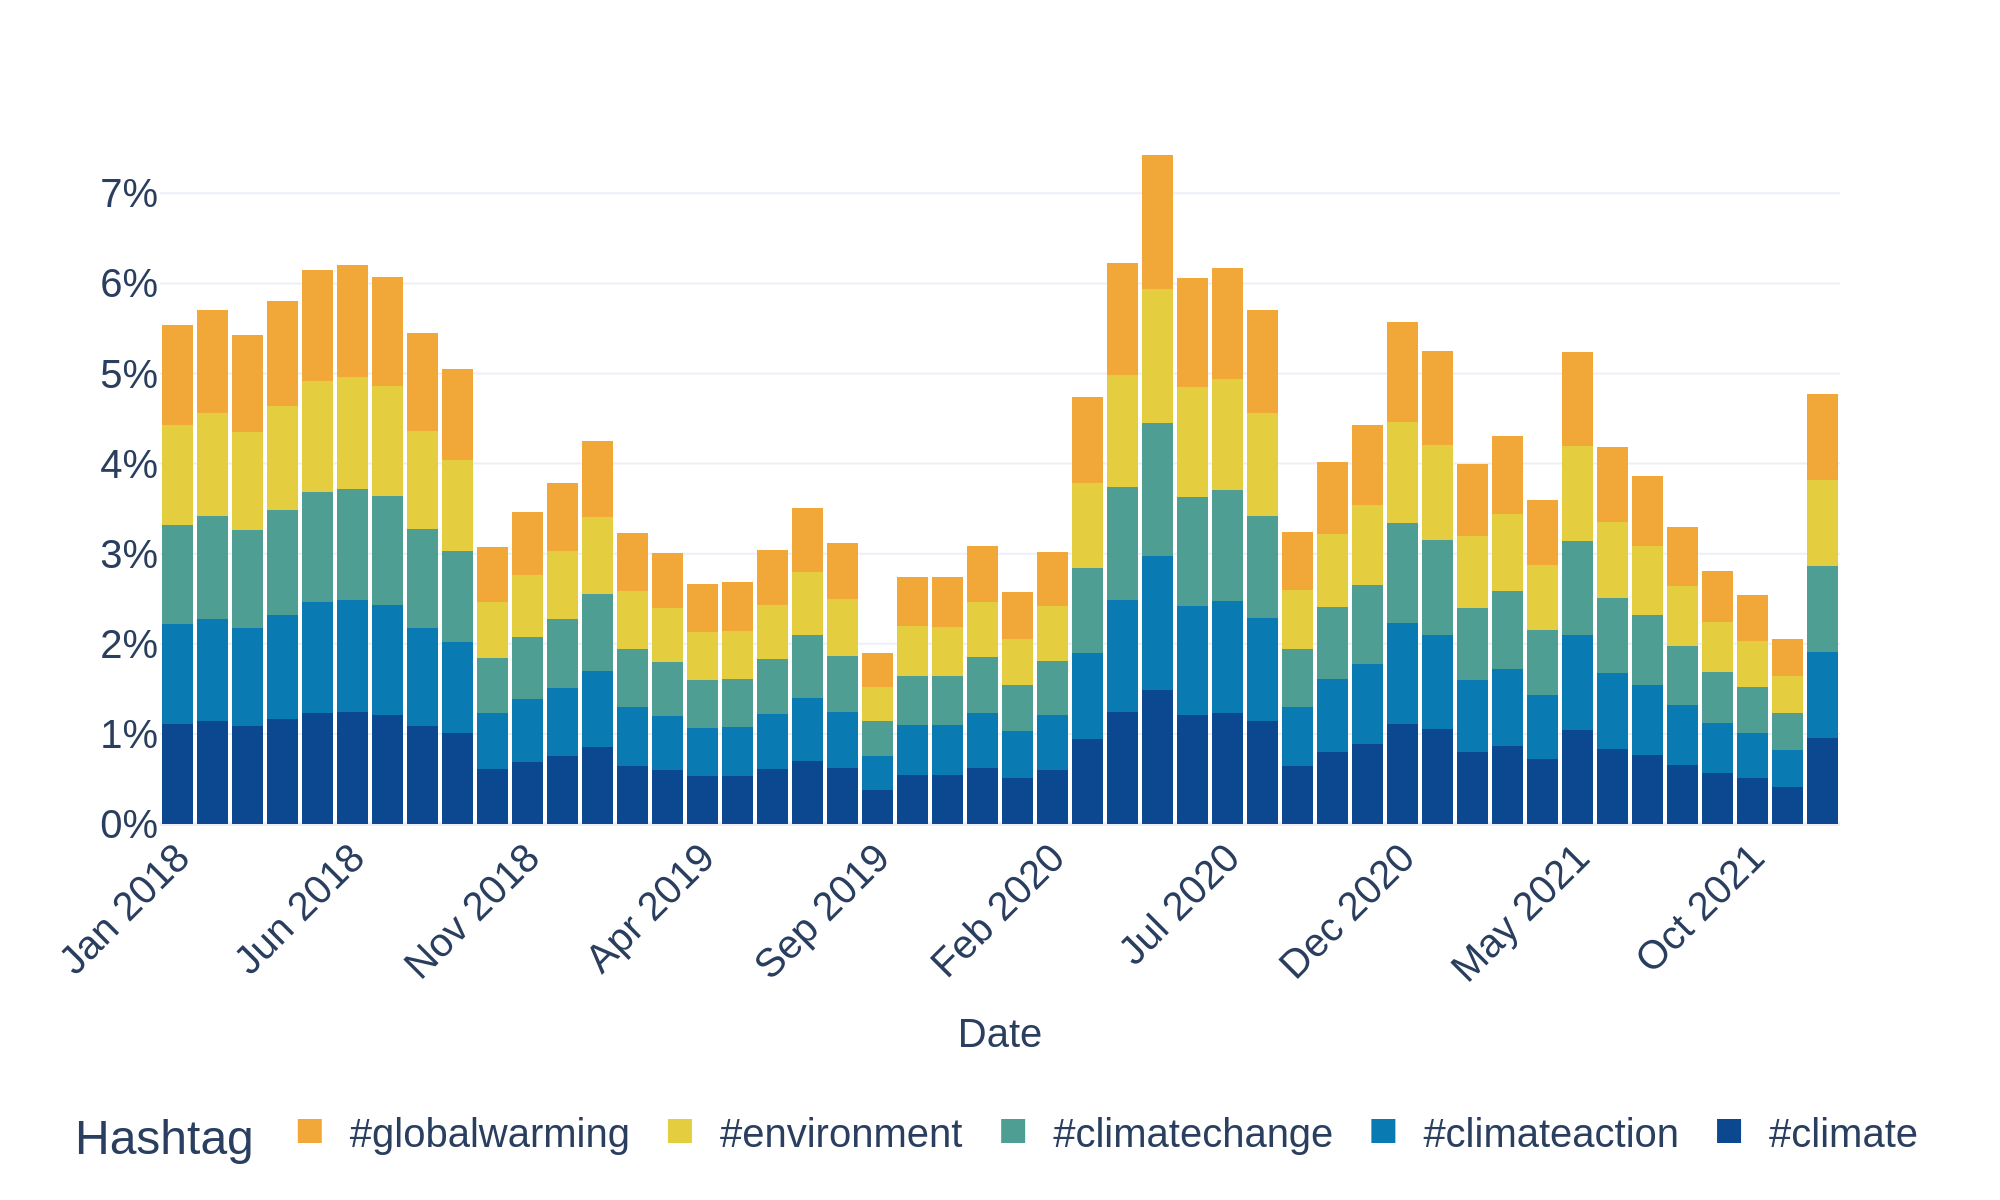
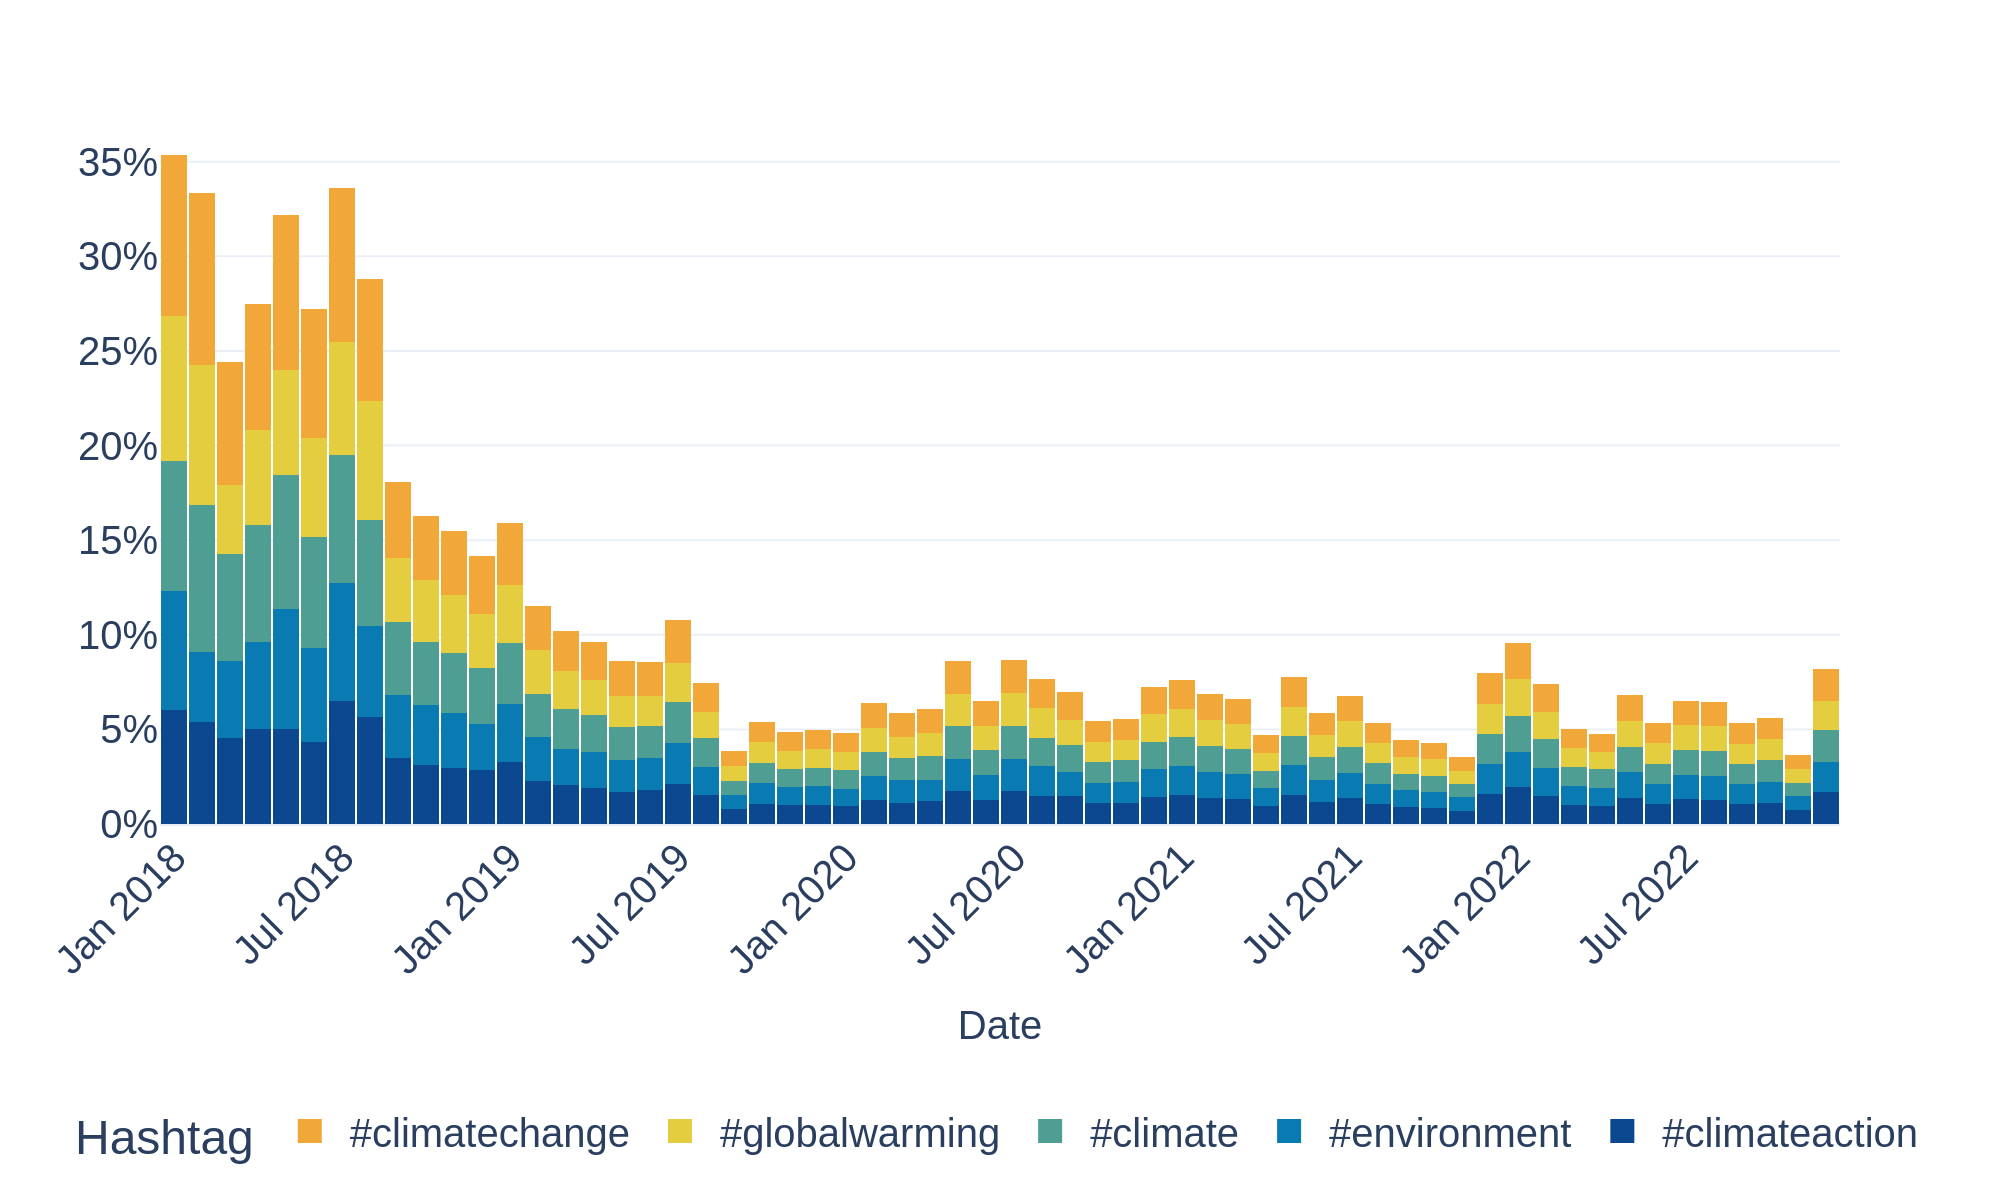
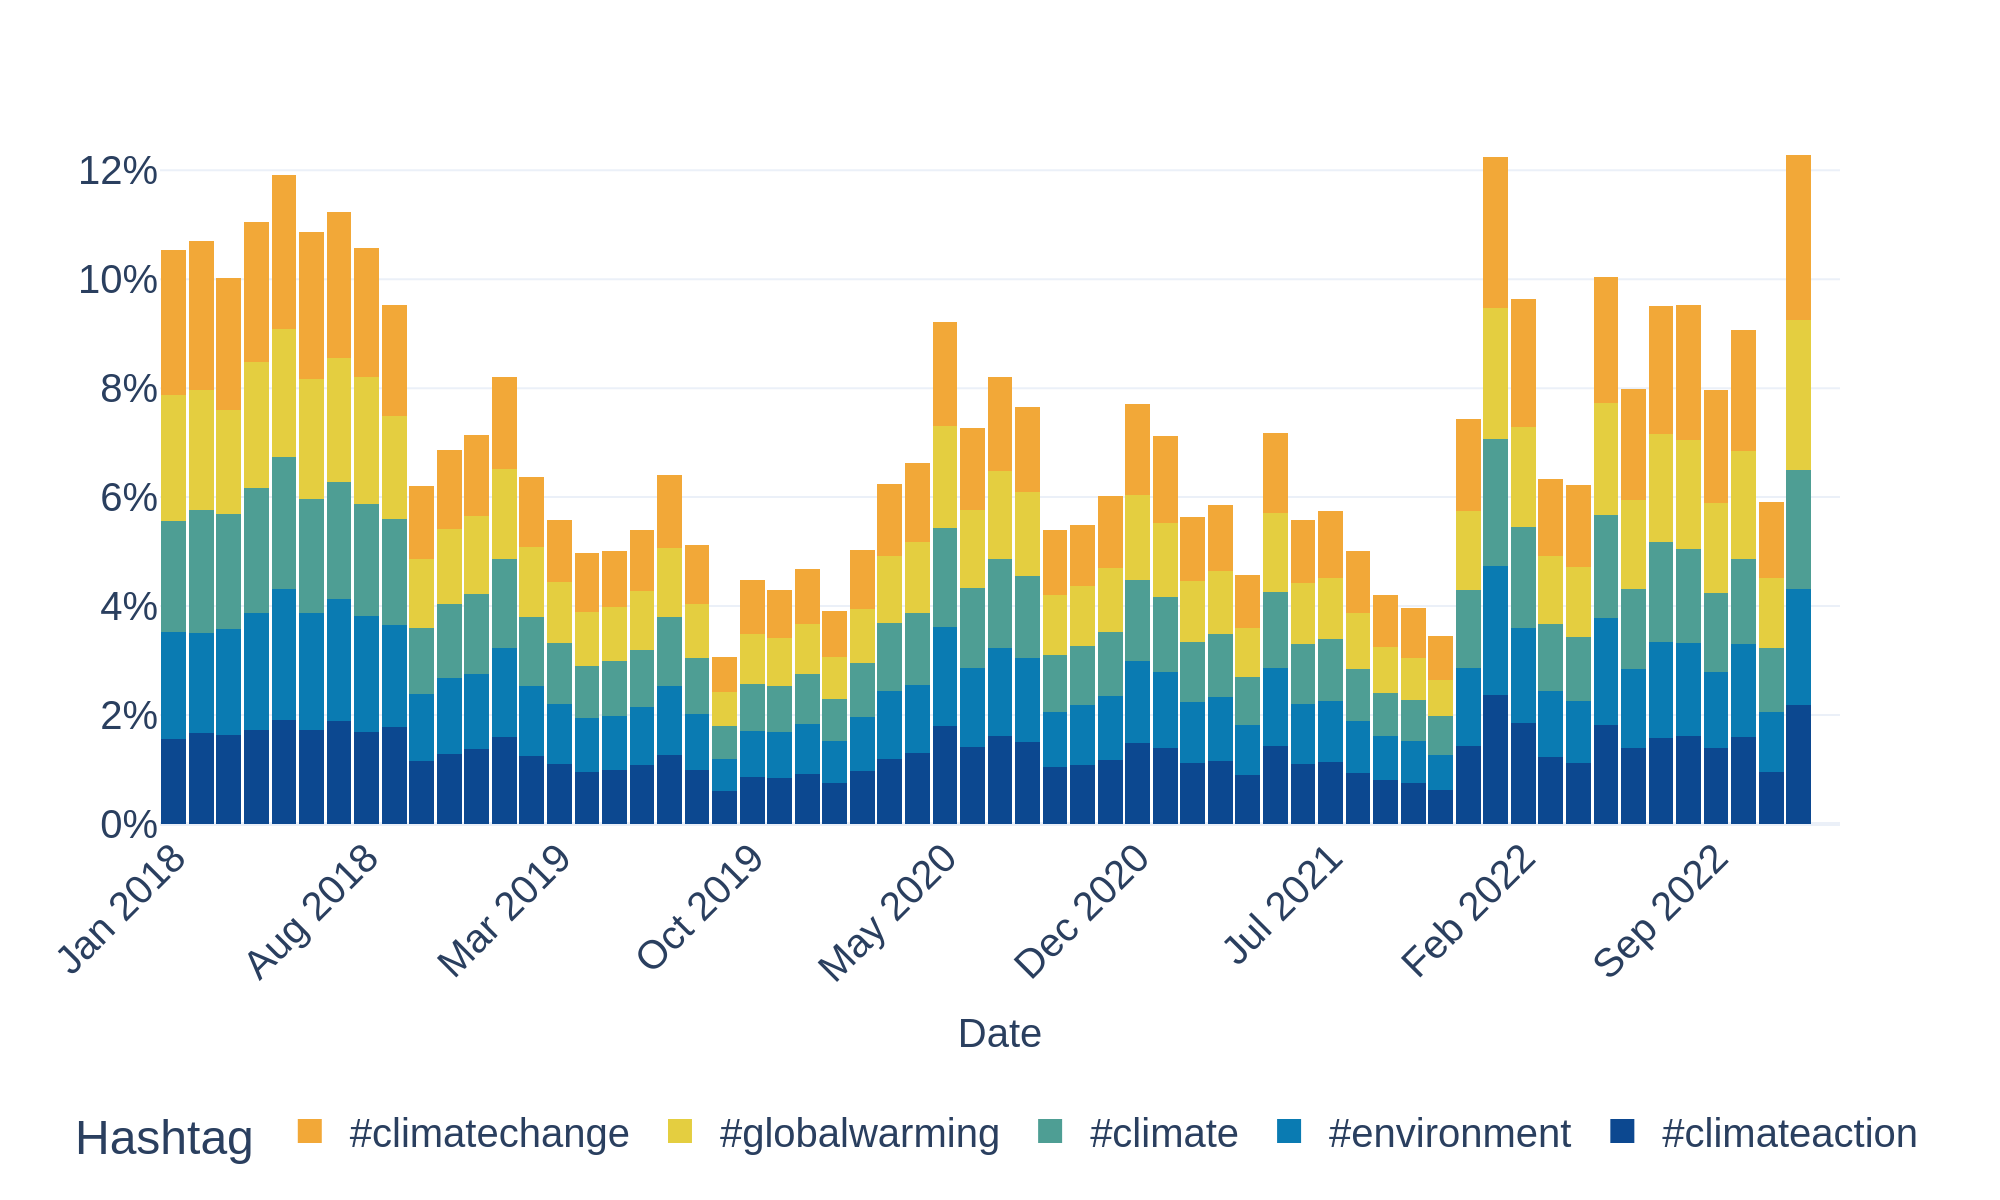
Hashtag dynamics over time
While general hashtags remain consistently dominant, event-driven hashtags display sharp, short-lived spikes, reflecting reactions to external events such as climate summits or major news cycles.
Twitter/X
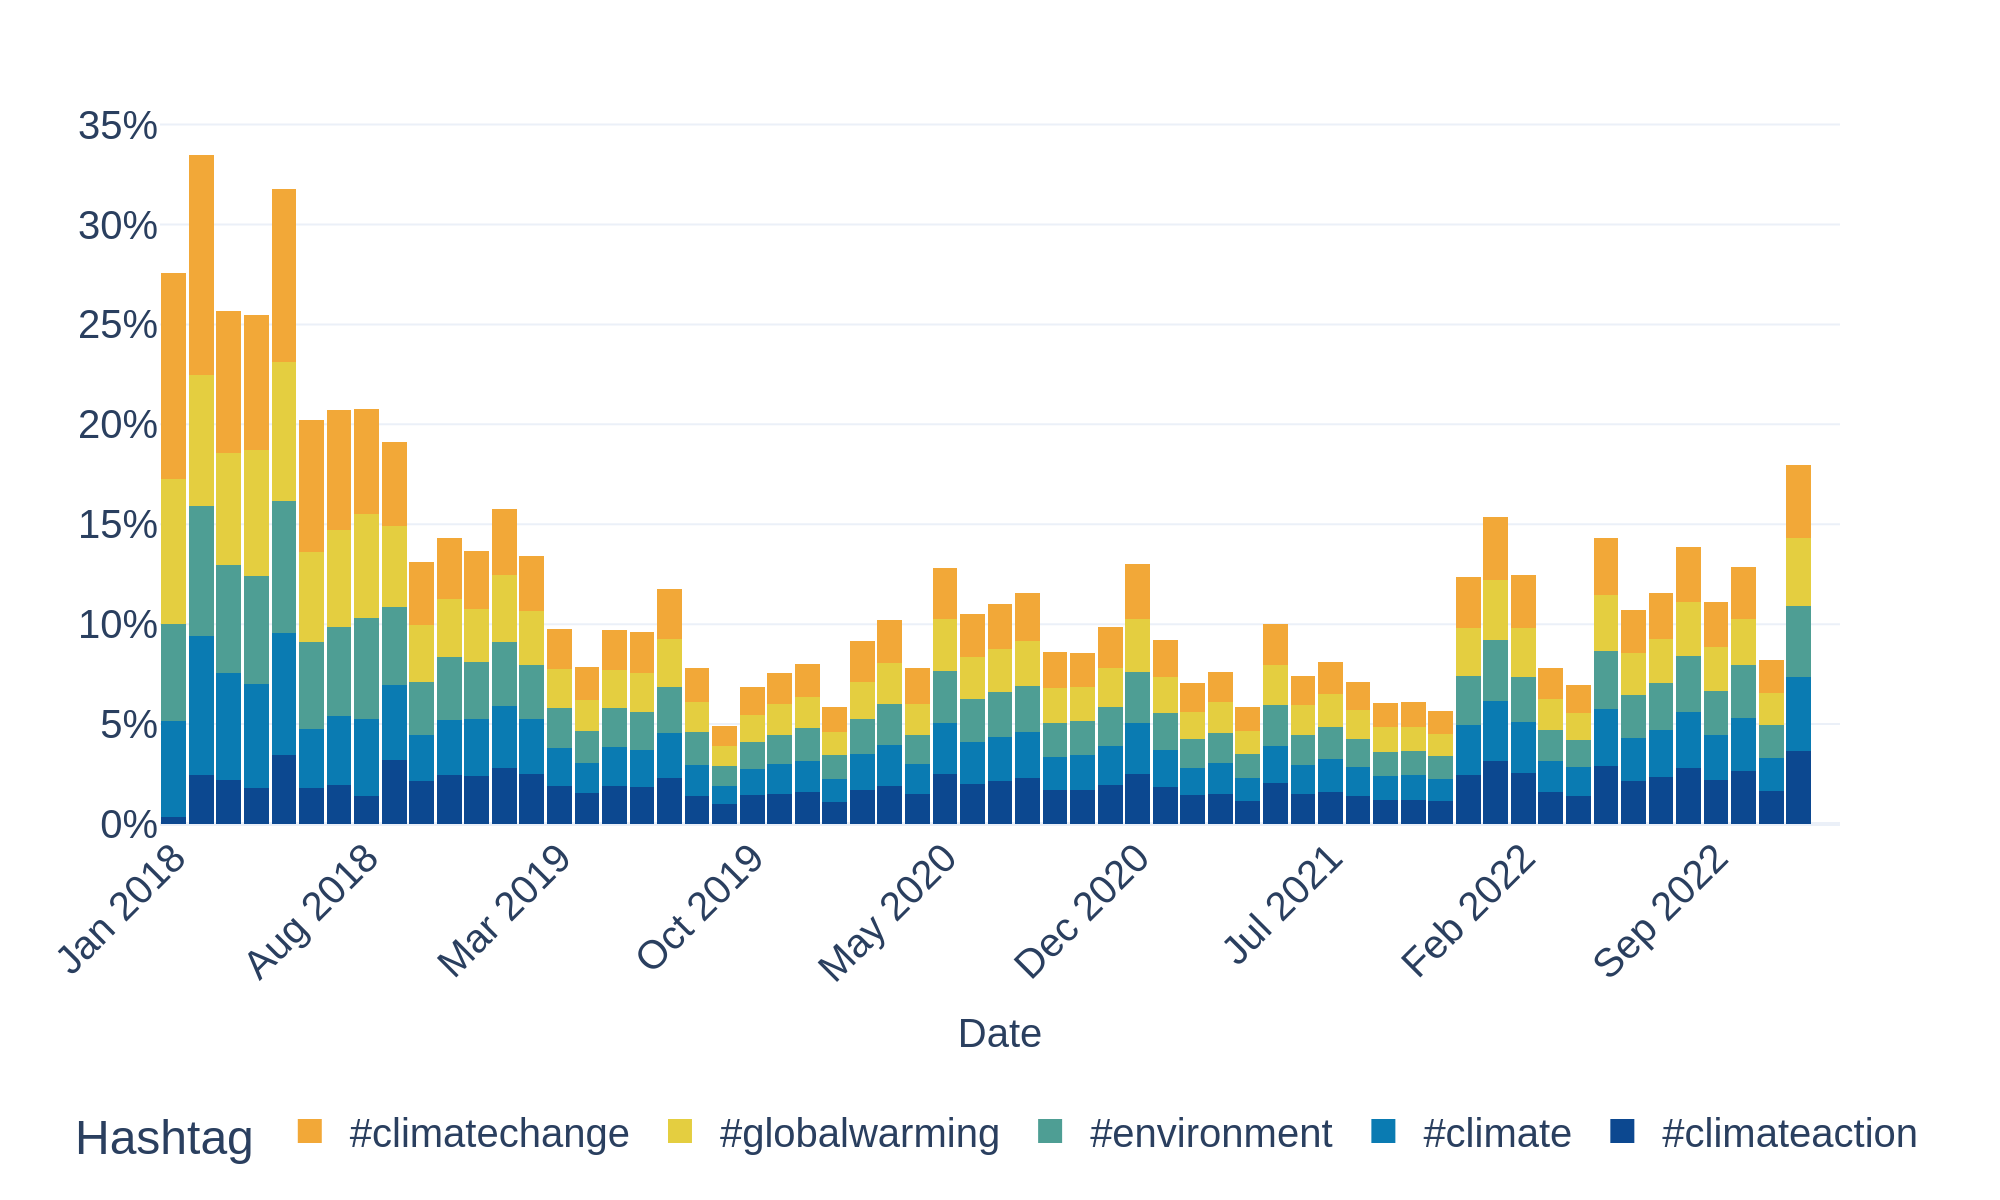
YouTube
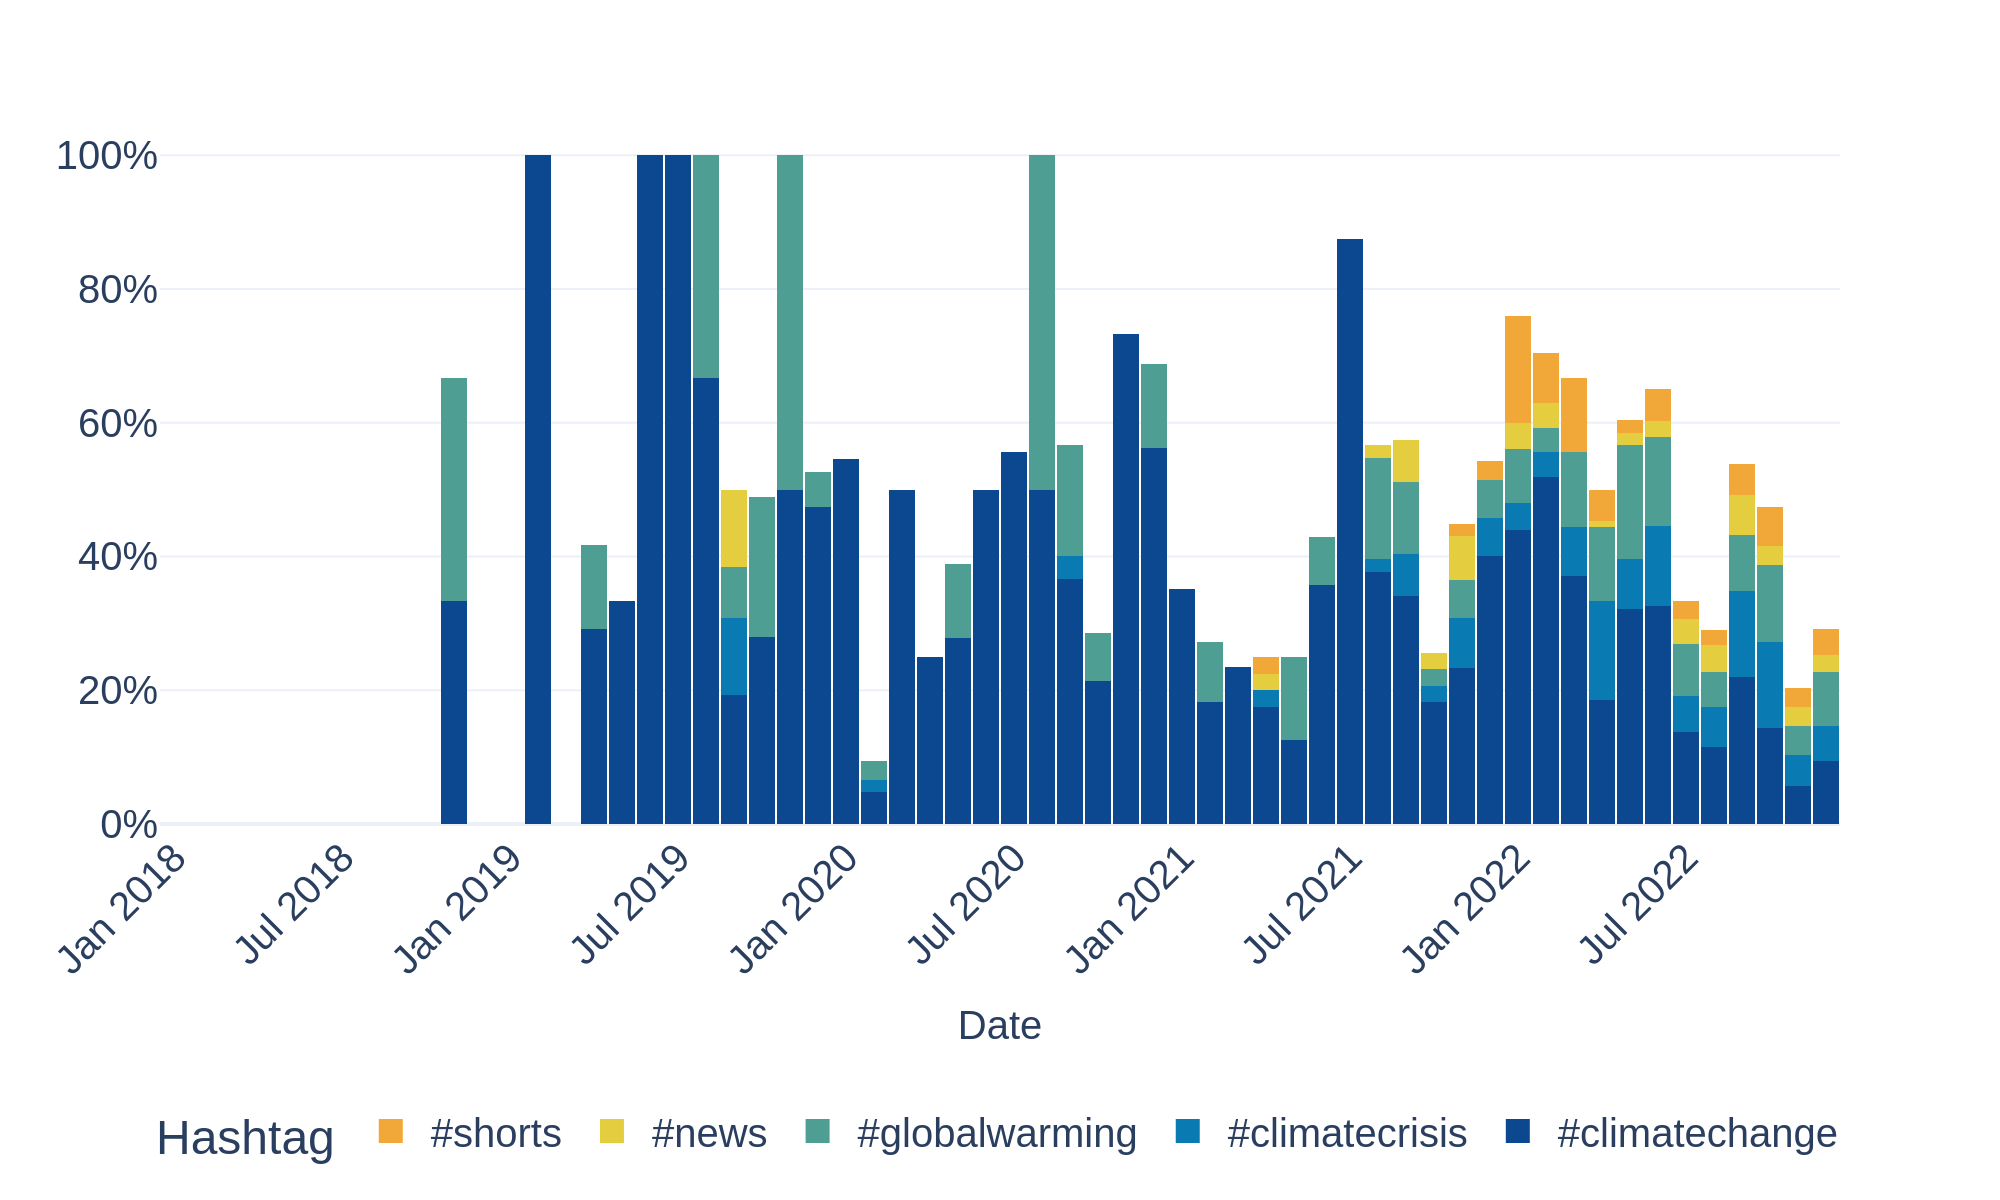
Global
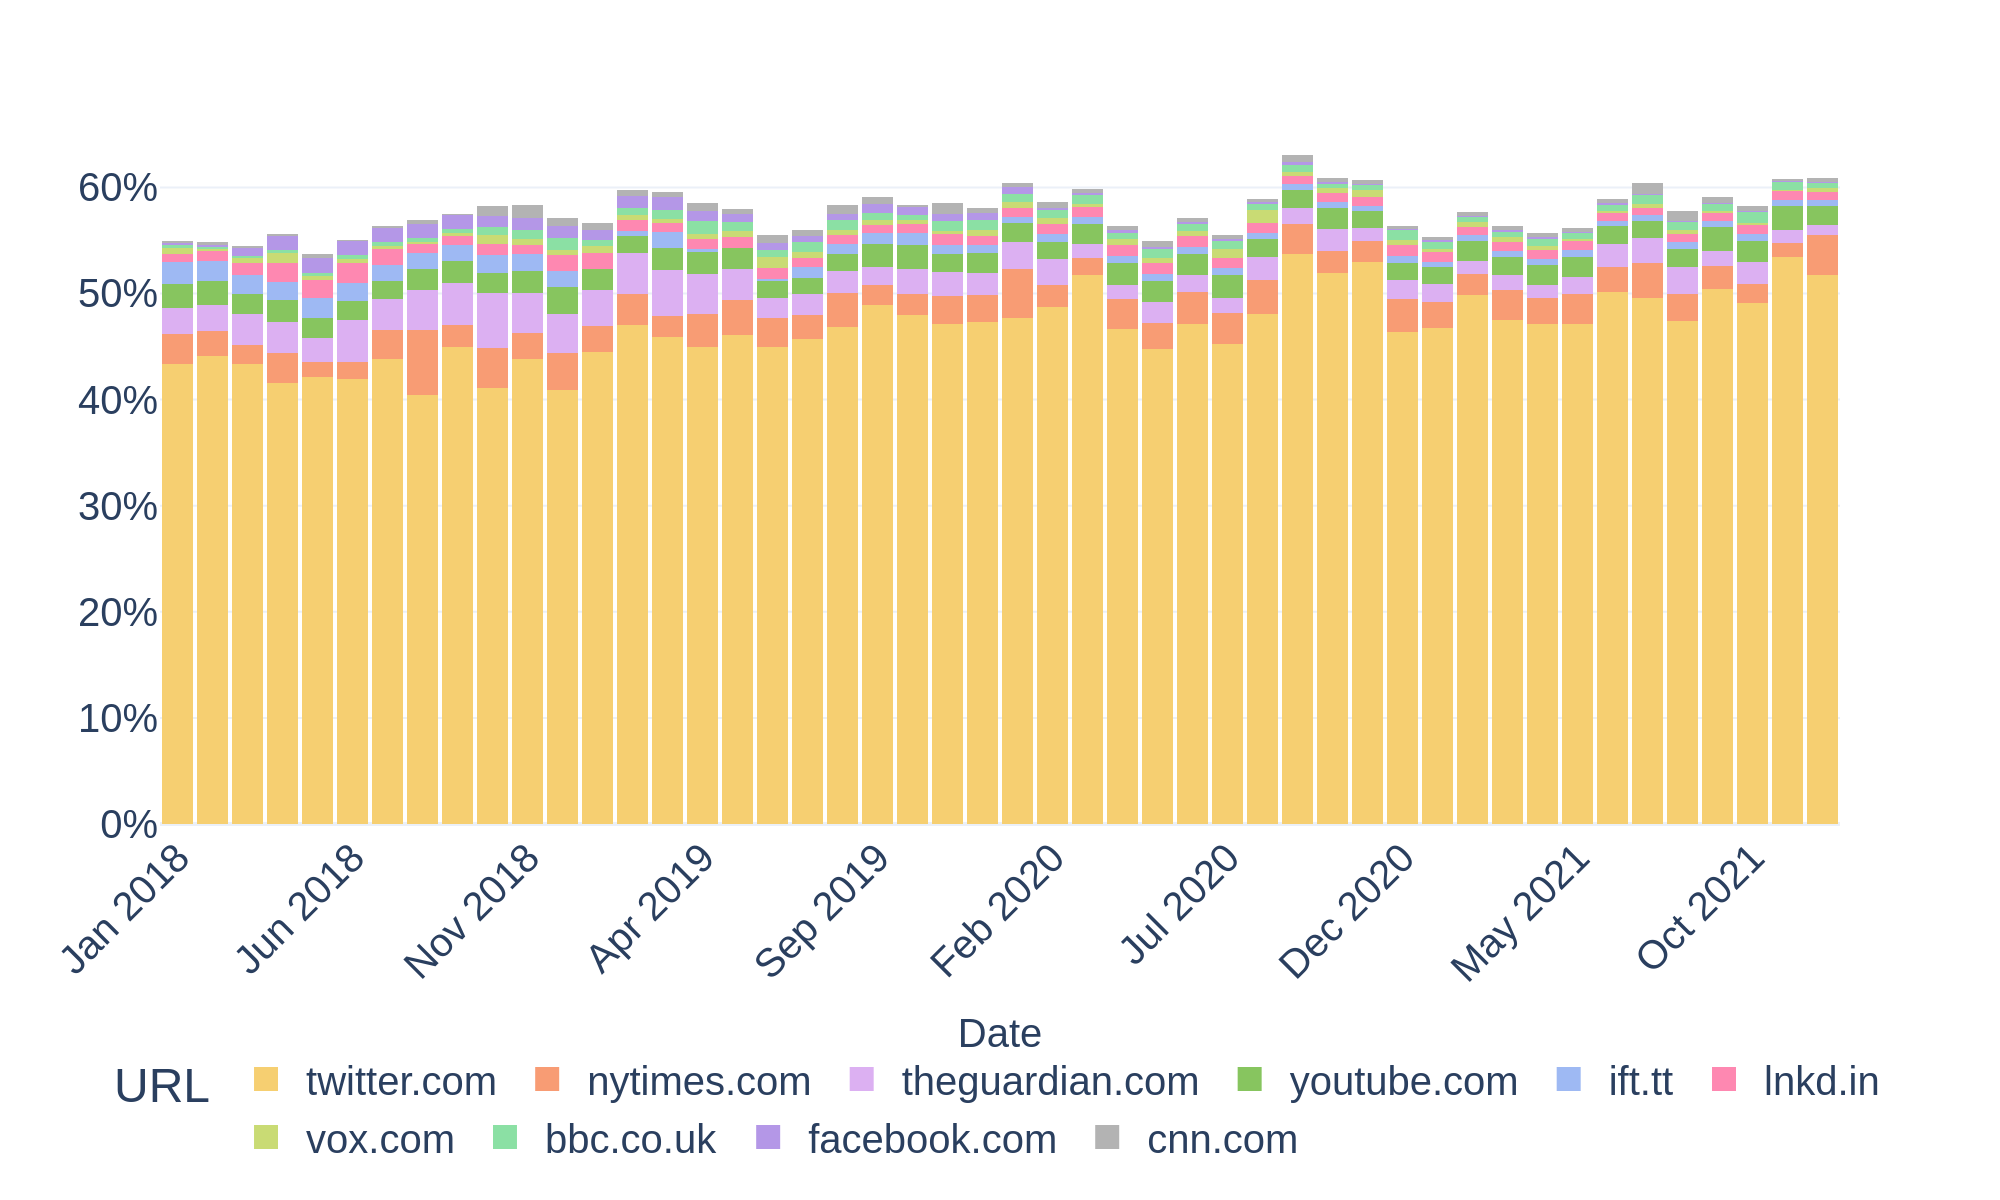
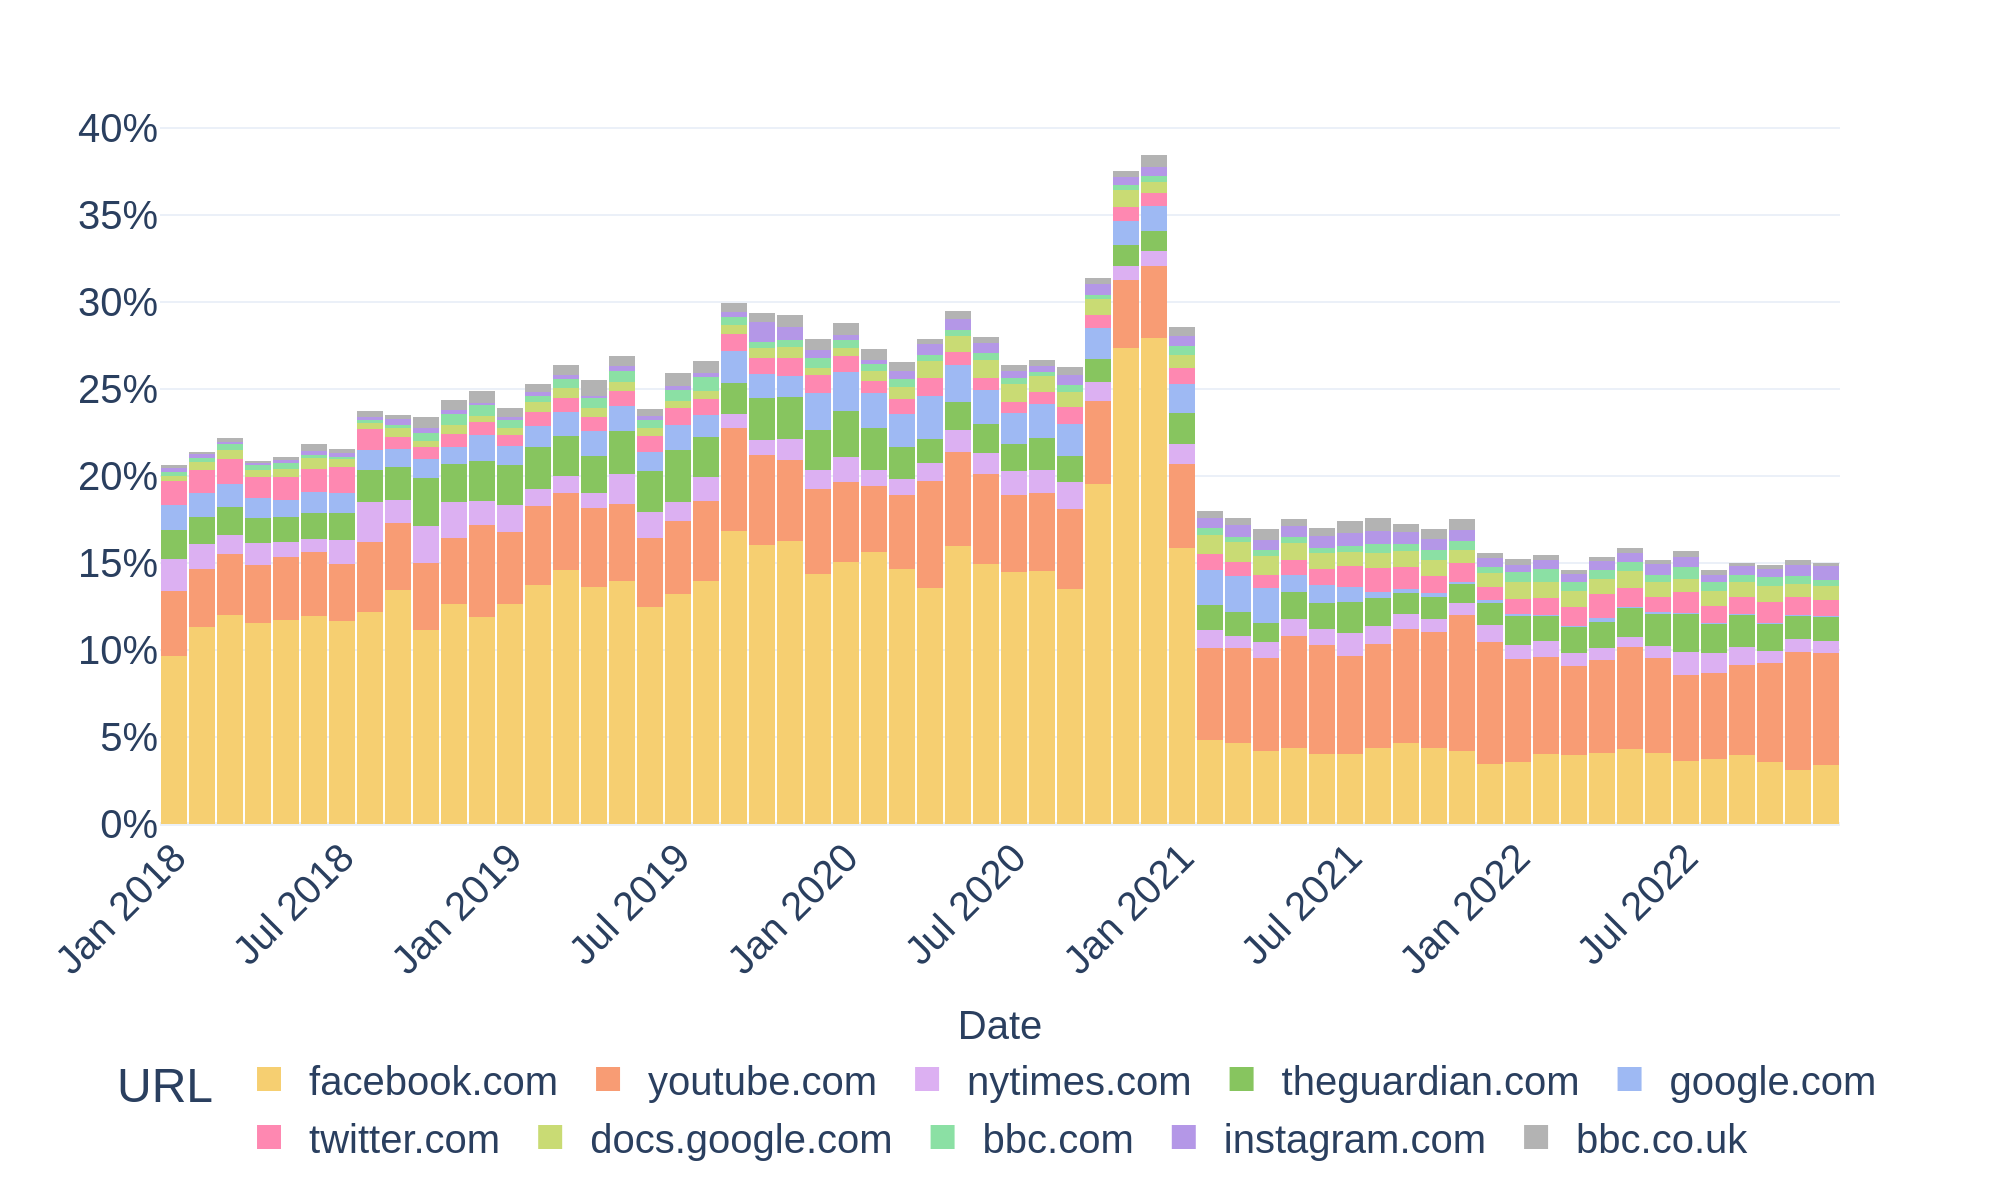
Most shared web pages and websites
This section explores where users get their information about climate change by analysing the web pages and domains most frequently shared on social media.
Understanding information sources is increasingly important in light of the rise of fake news, misleading content, and low-quality information ecosystems.
By tracking shared links, we can observe which voices, outlets, and platforms shape the online climate discourse.
Through a continuously updated domain classification, the dashboard monitors the websites most commonly referenced when discussing climate change across platforms.
What you will find here
- Most shared articles, highlighting the specific pieces of content that circulated widely
- Most shared domains, revealing the information sources users rely on
- Platform-specific differences in information consumption and sharing behavior
⚠️ Interpretation note
High sharing frequency does not imply high credibility. This analysis captures exposure and circulation, not factual accuracy or editorial quality.
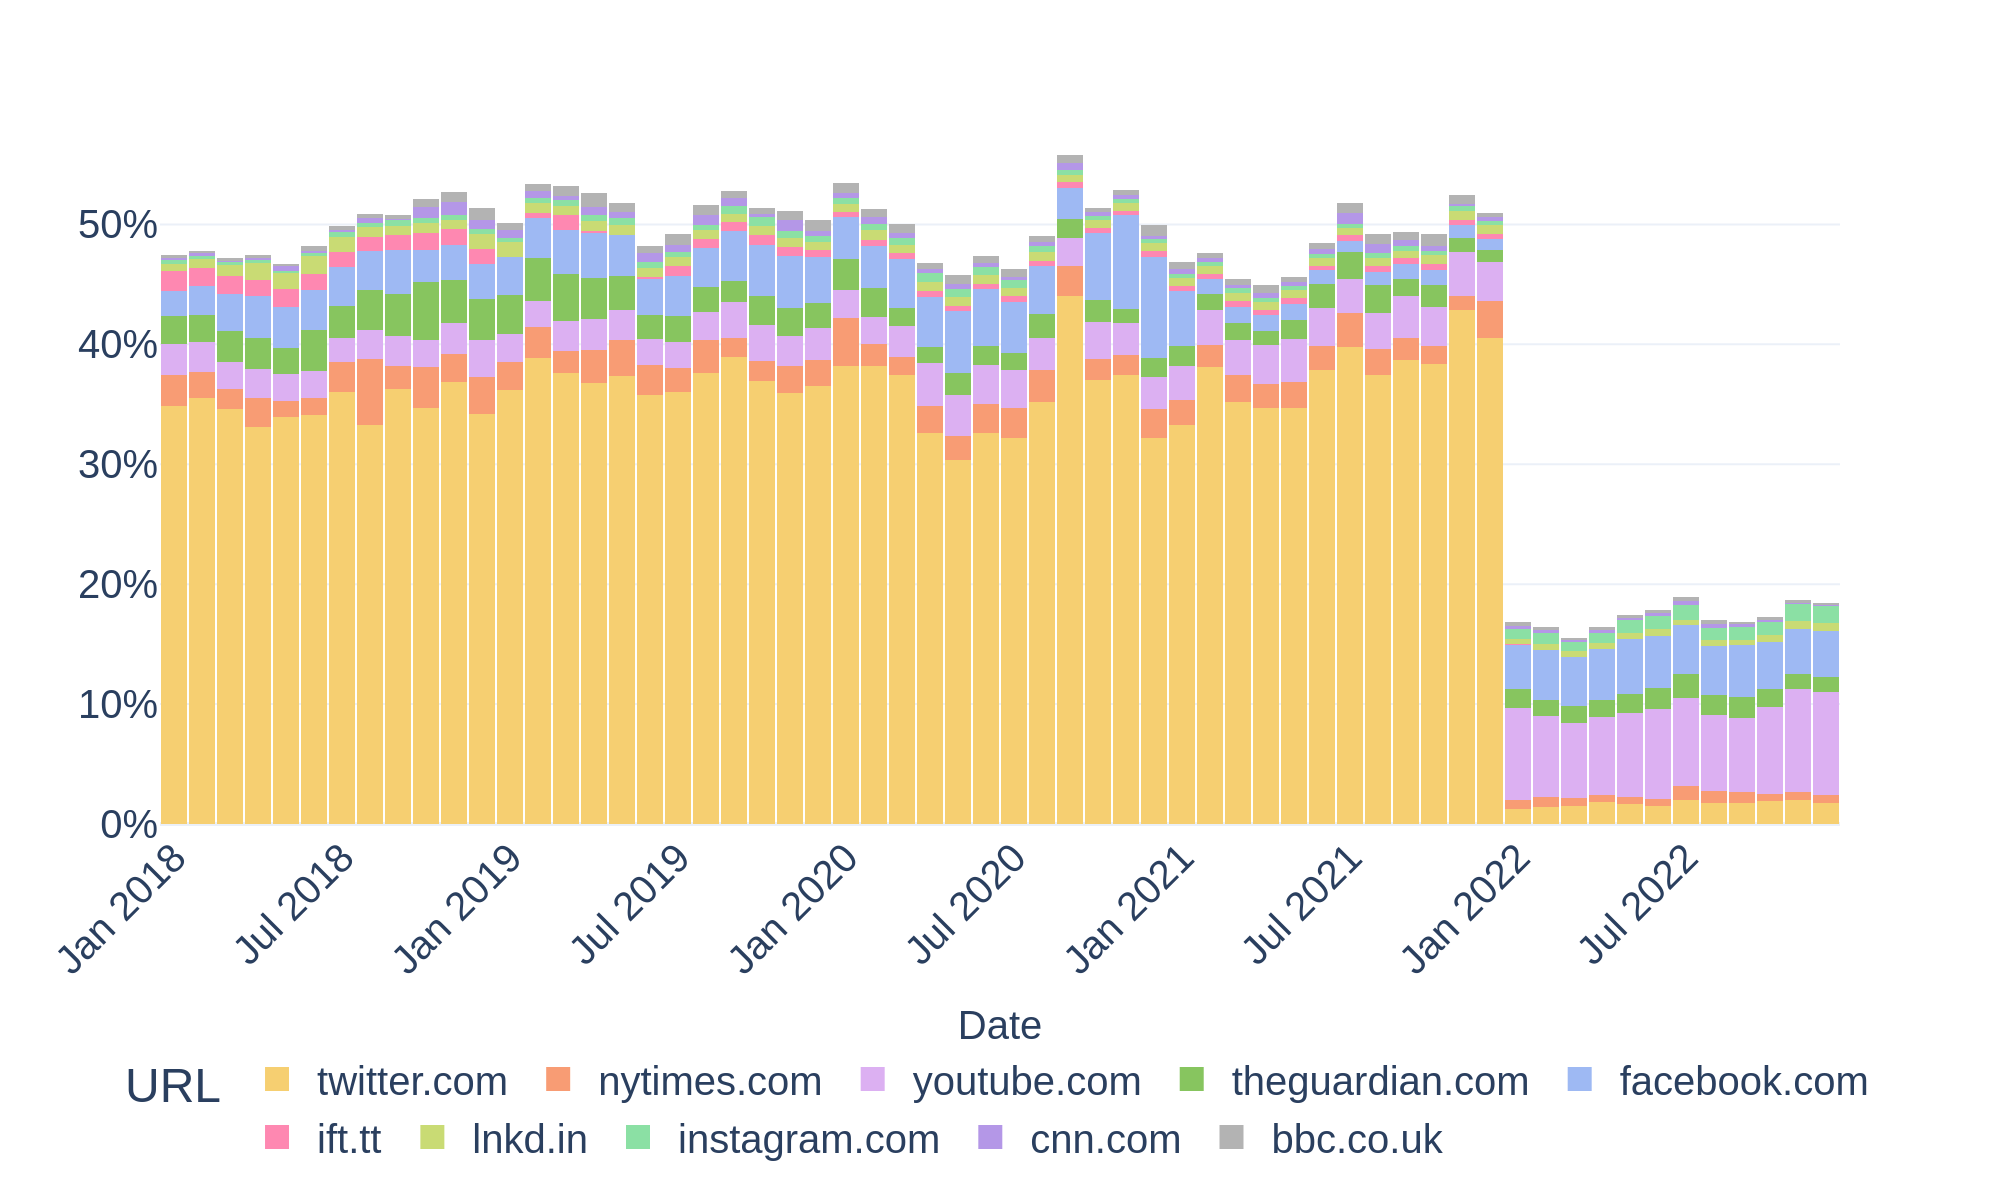
Twitter/X
Most shared articles and pages
| 1 | Global Climate Change – Anne-Maria Yritys leadingwithpassion.org | 7.9k shares |
| 2 | Donald J. Trump on X x.com | 3.0k shares |
| 3 | Global Climate Change – Anne-Maria Yritys leadingwithpassiong.org | 2.9k shares |
| 4 | Earth Central XYZ earthcentral.org | 2.8k shares |
| 5 | Losing Earth: The Decade We Almost Stopped Climate Change nytimes.com | 2.6k shares |
Most frequent websites
Most shared articles and pages
| 1 | Instagram Login instagram.com | 2.4k shares |
| 2 | Home – BlueSkye.Life blueskye.life | 1.5k shares |
| 3 | BlueSkye Foundation vimeo.com | 1.2k shares |
| 4 | BlueSkye.Life facebook.com | 1.1k shares |
| 5 | BlueSkye Foundation blueskye.live | 1.1k shares |
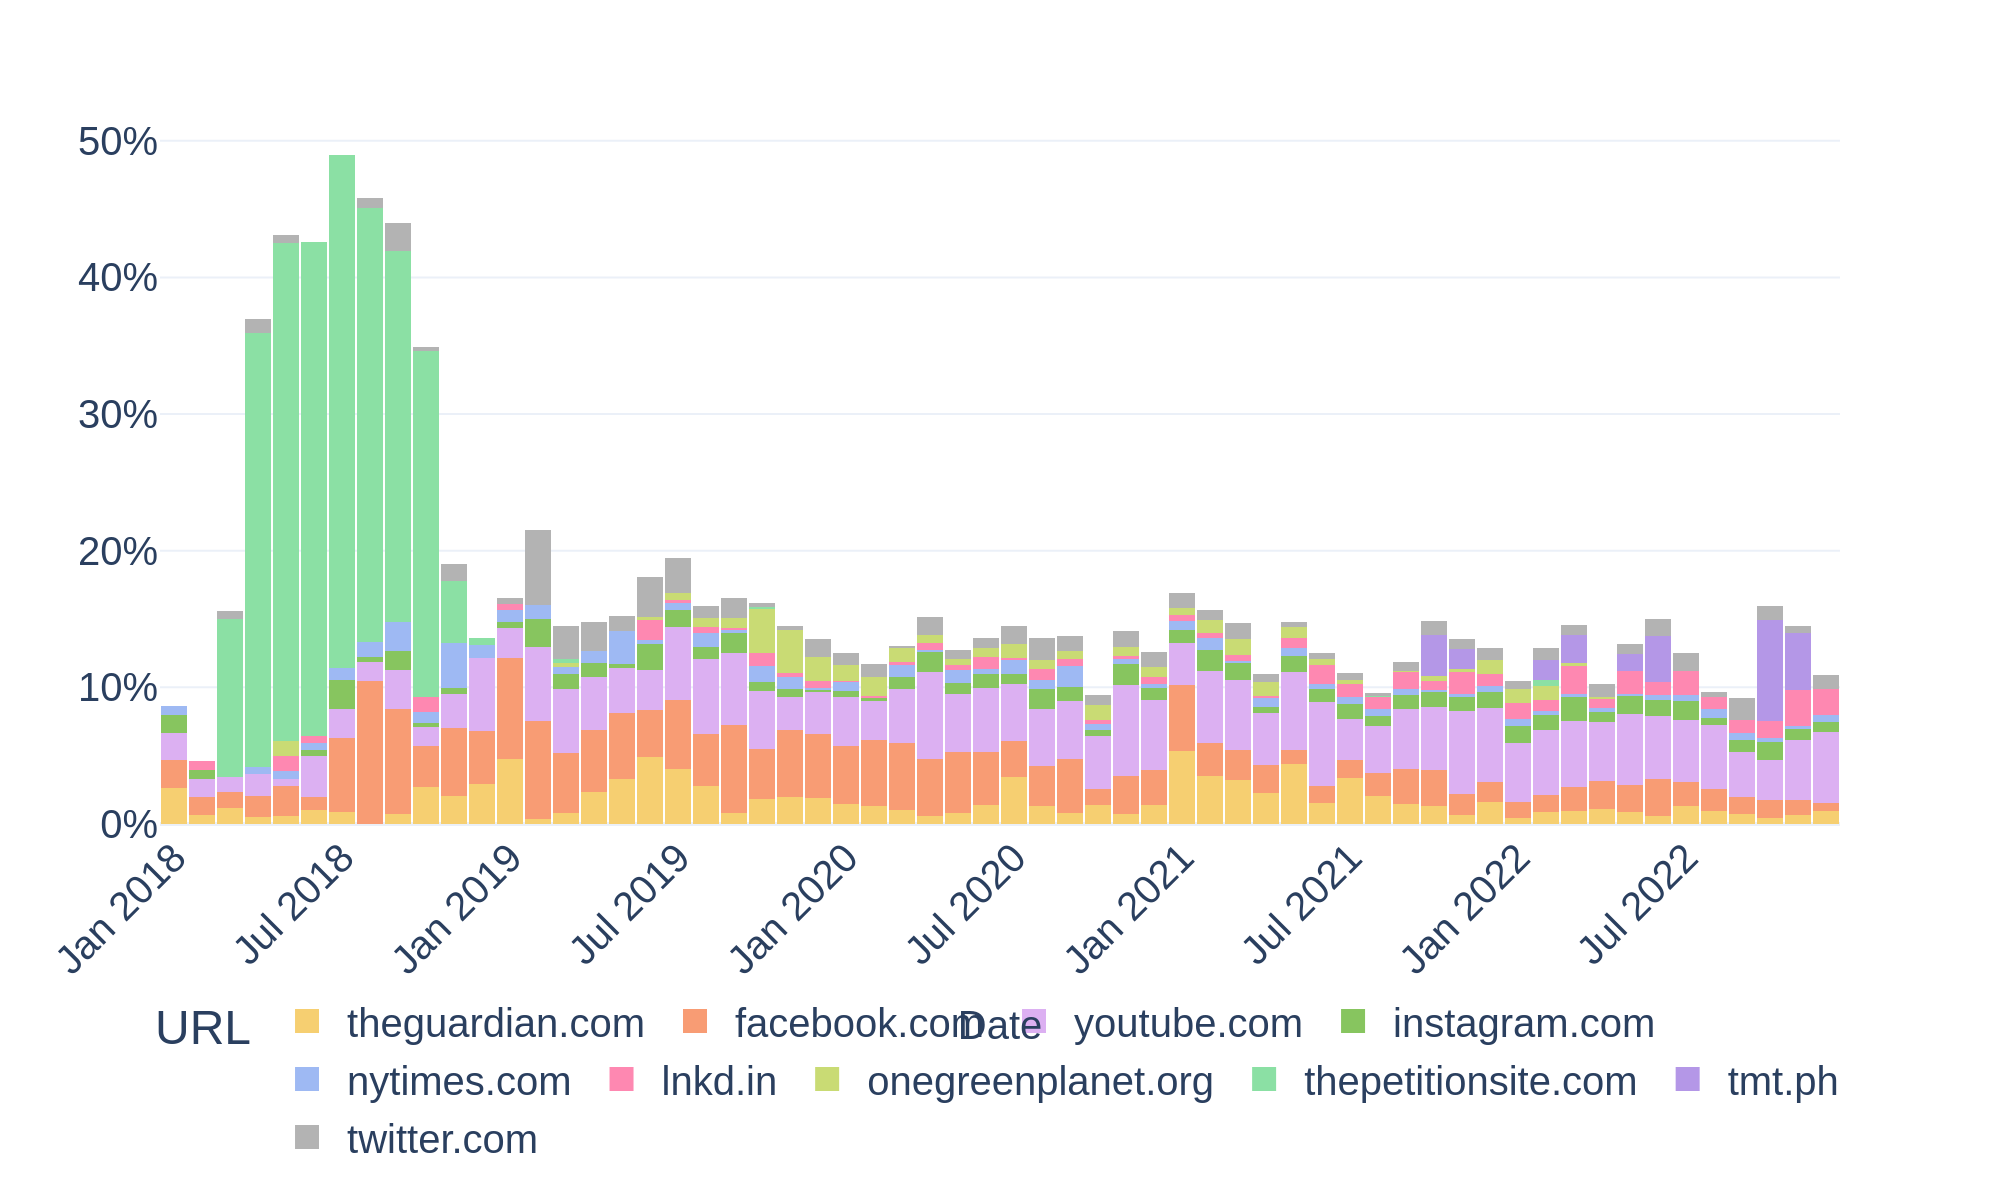
Most frequent websites
Most shared articles and pages
| 1 | petition: Tell influential environmentalists that Animal Agriculture is the biggest destroyer of our planet! thepetitionsite.com | 582 shares |
| 2 | Extiction Rebellion Australia – We are in a climate emergency ausrebellion.earth | 57 shares |
| 3 | The Dimming, Full Length Climate Engineering Documentary geoengineeringwatch.org | 55 shares |
| 4 | EWTN News Nightly ewtn.com | 37 shares |
| 5 | TEDxGateway Climate Countdown 2021 tedxgateway.com | 32 shares |
Most frequent websites
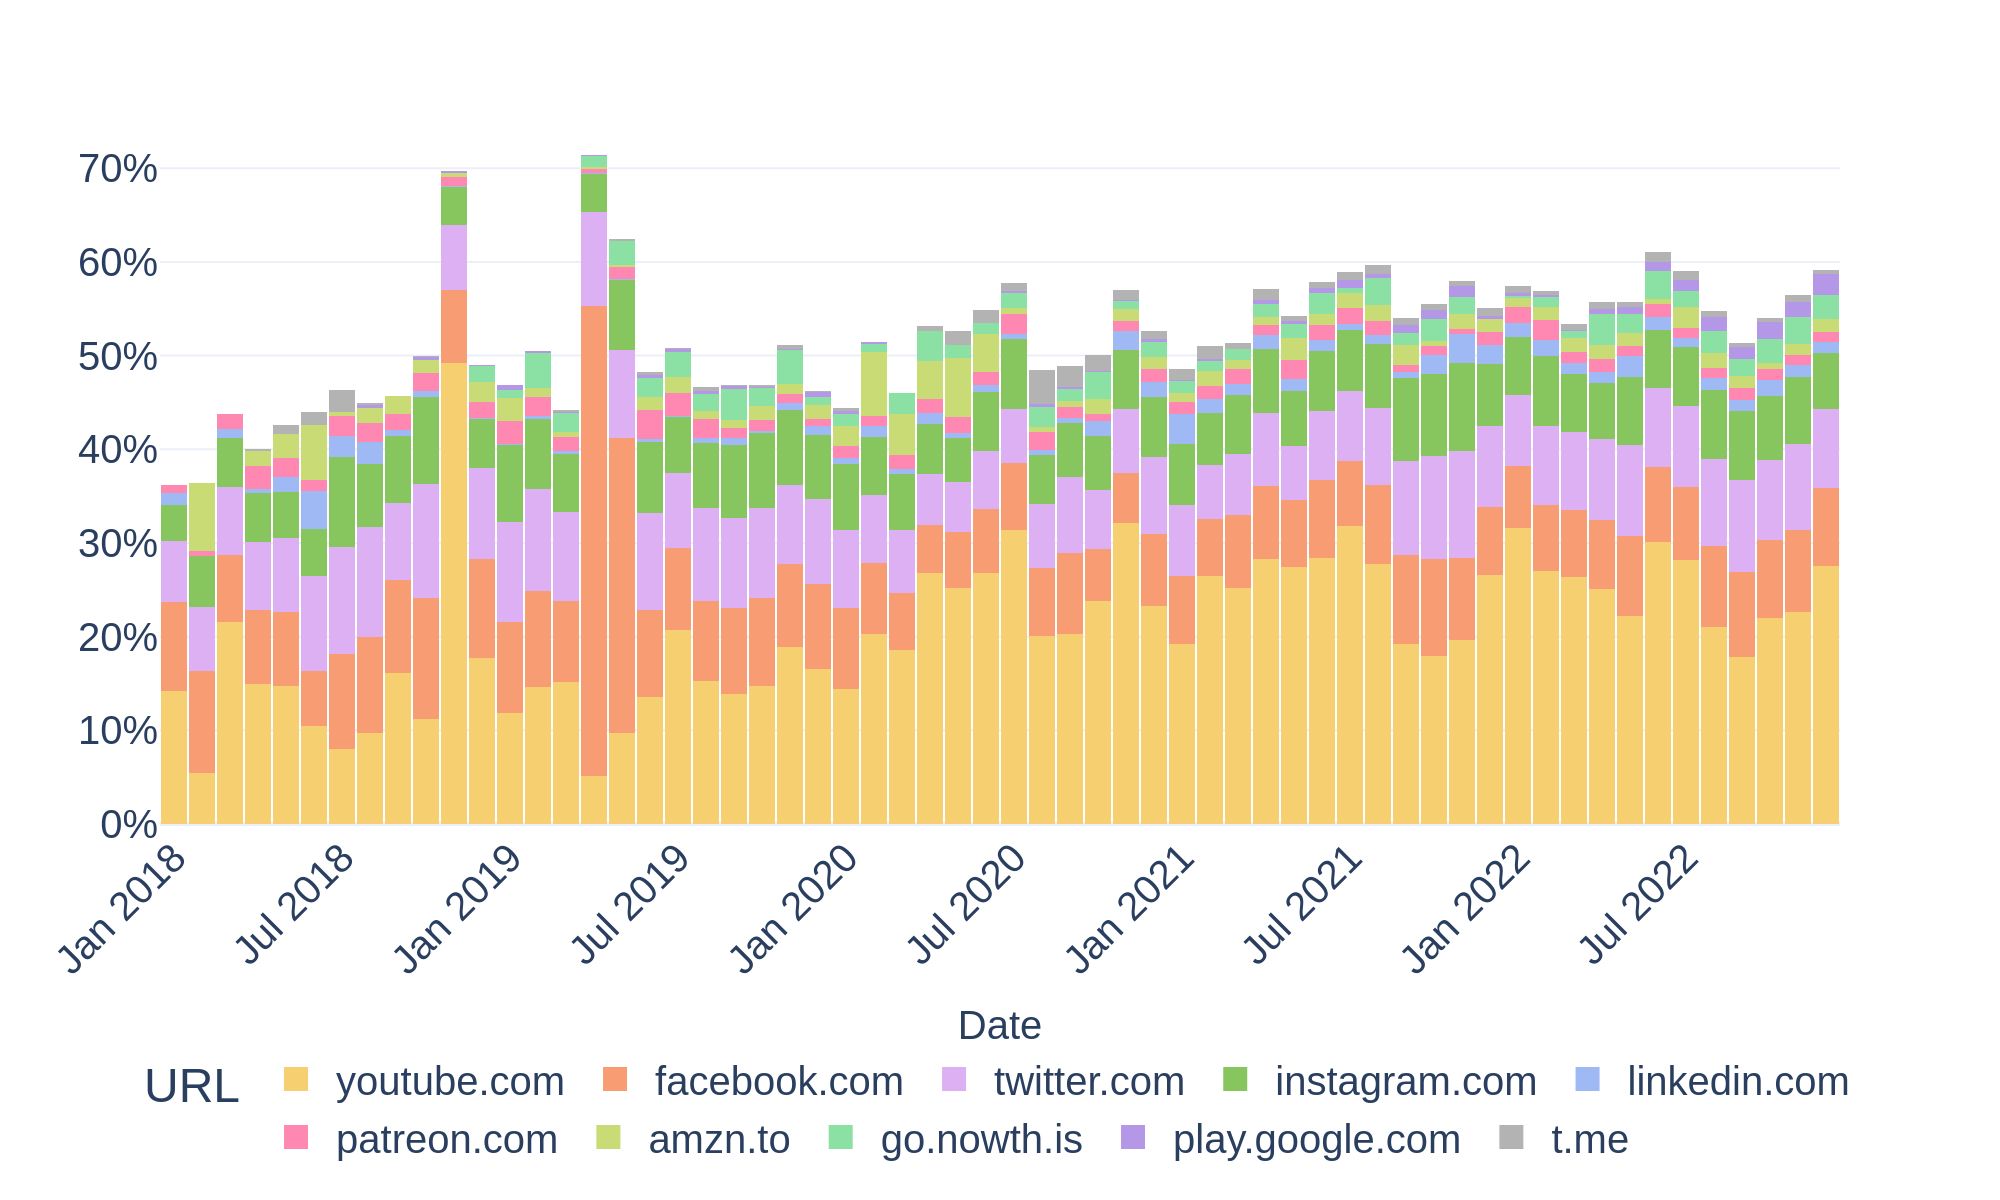
YouTube
Most shared articles and pages
| 1 | Zee News: Live News in Hindi play.google.com | 566 shares |
| 2 | WION: Breaking News, Latest News wionews.com | 559 shares |
| 3 | WION (@WIONews) / X x.com | 559 shares |
| 4 | WION facebook.com | 559 shares |
| 5 | WION – YouTube youtube.com | 559 shares |
Most frequent websites
Global
Engaging with reliable (and unreliable) sources
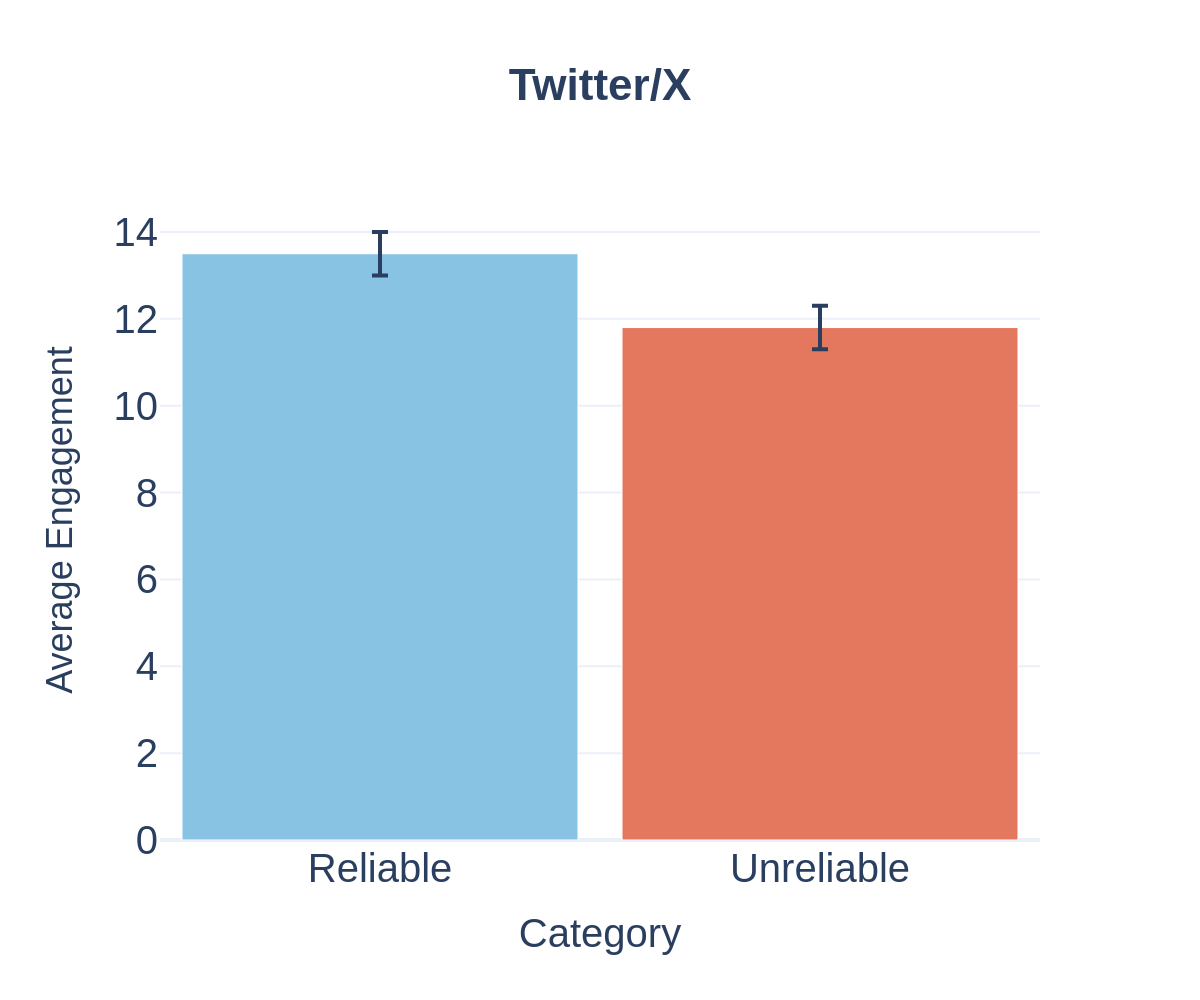
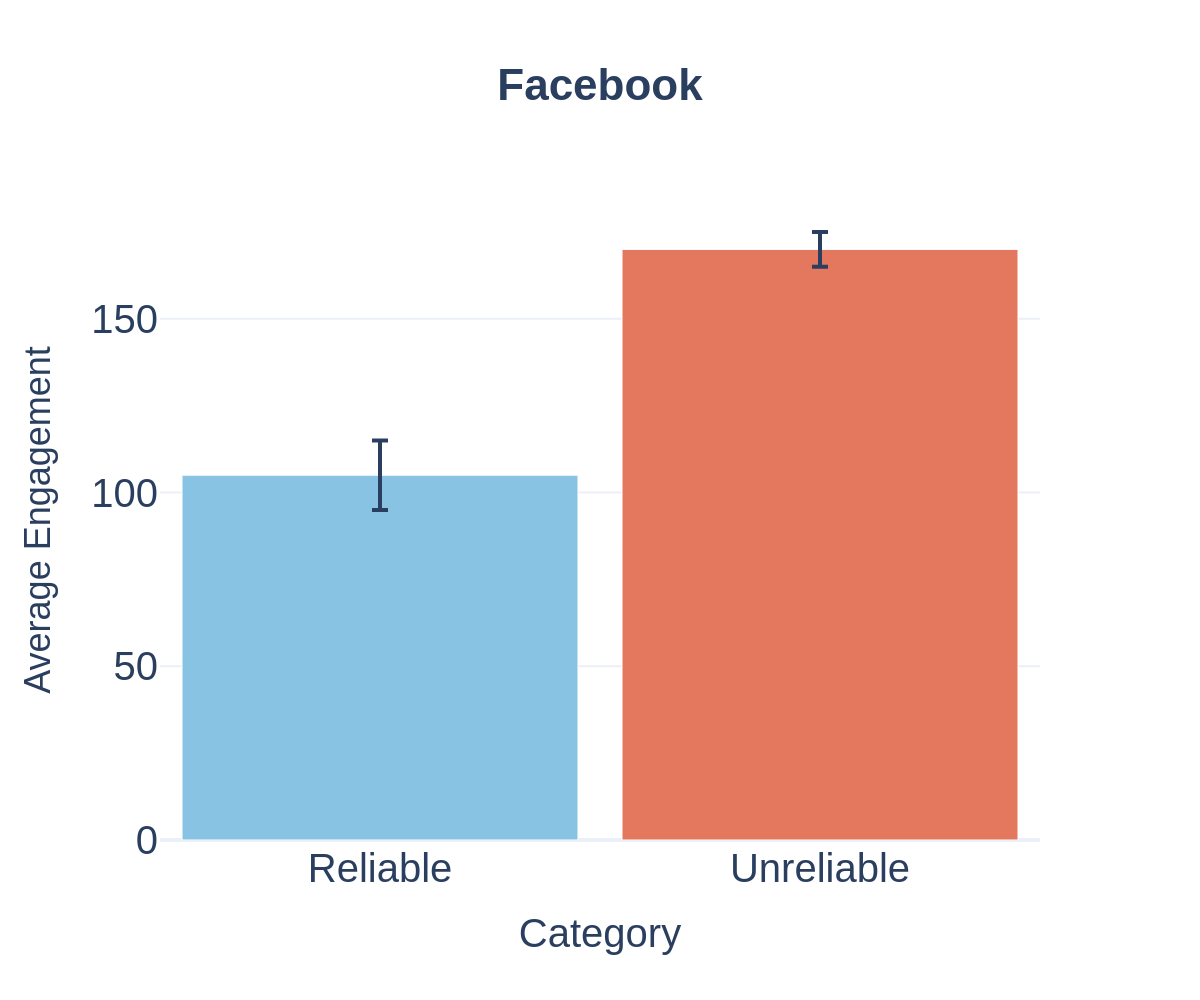
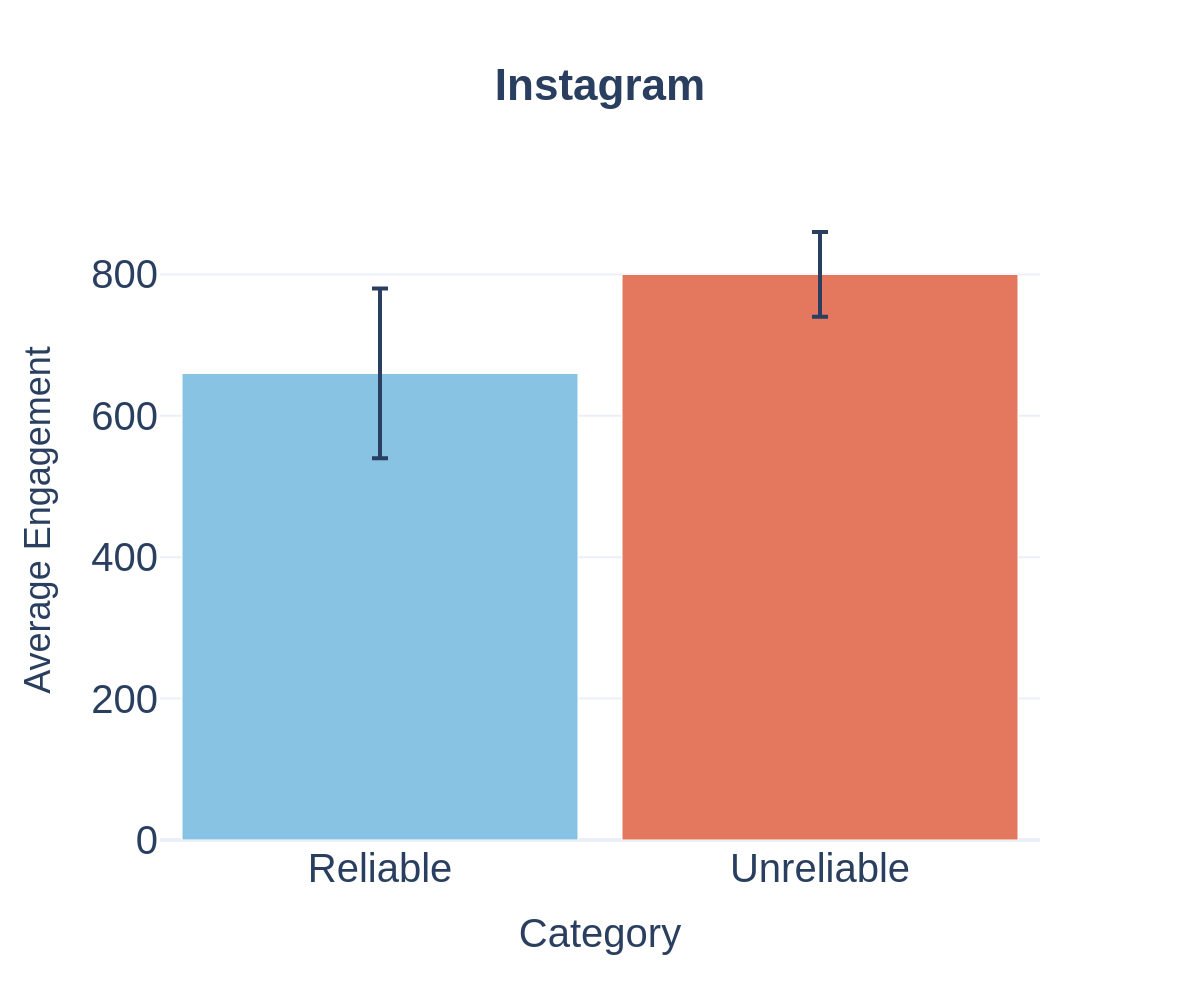
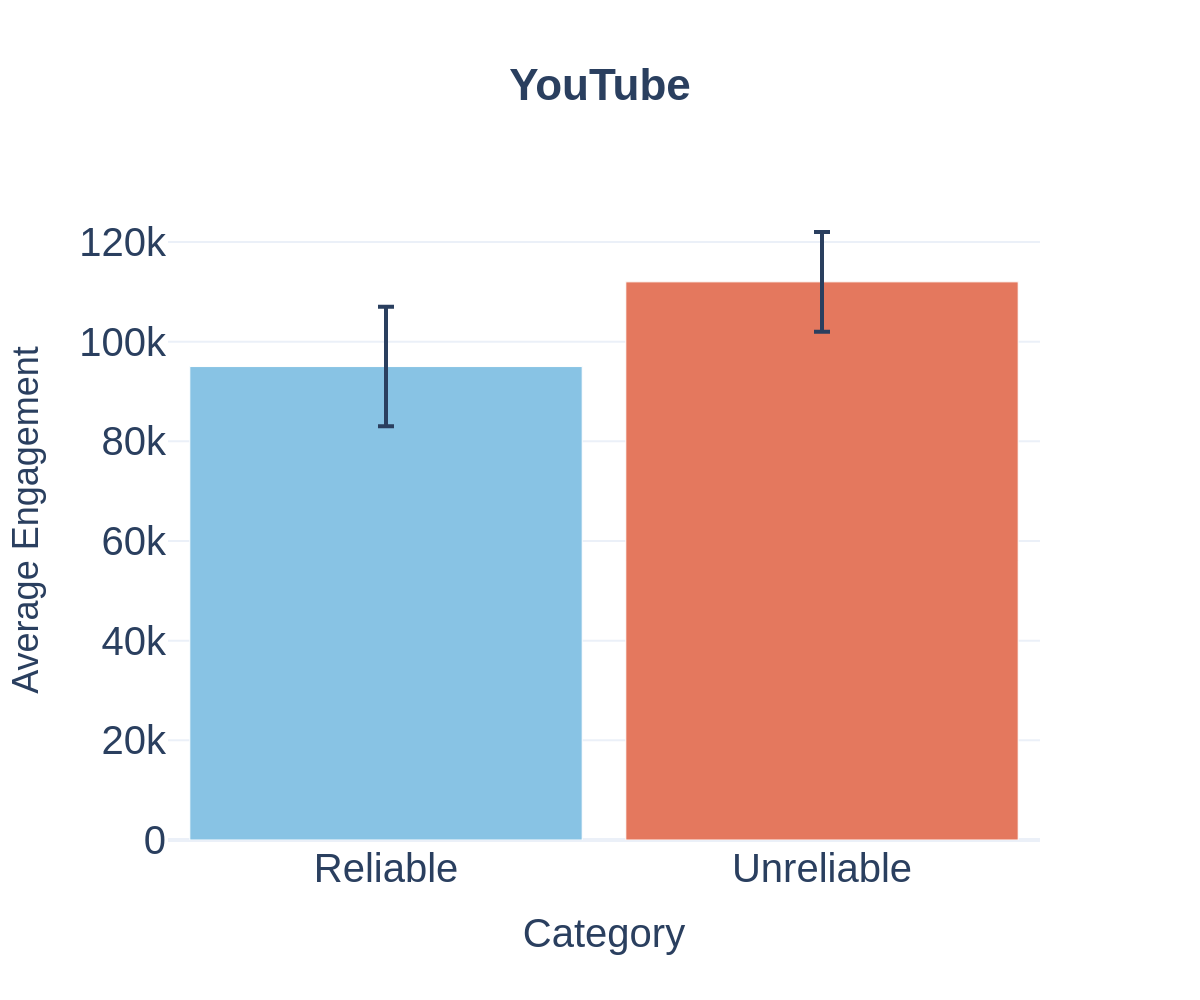
Although reliable sources generate the majority of posts in the dataset, unreliable content often attracts higher average engagement.
We analyzed millions of climate-related posts across Facebook, Instagram, YouTube, and Twitter/X, comparing interactions (likes, shares, and comments) for content shared from sources classified as 🔵 reliable or 🔴 unreliable using independent ratings from NewsGuard and Media Bias/Fact Check.
The results reveal a consistent pattern across platforms: posts linking to unreliable sources tend to receive more engagement on average than those from reliable outlets.
Key observations
- Higher engagement for unreliable content
On Facebook, Instagram, and YouTube, posts linking to unreliable sources generate more average interactions than posts from reliable outlets. - Platform differences
Twitter/X is the only platform where reliable sources slightly outperform unreliable ones in terms of average engagement. - Disproportionate impact
Despite representing only a small fraction of total posts (≈7%), unreliable sources generate disproportionately high engagement, amplifying their visibility within the information ecosystem.
Interpretation
This pattern may reflect multiple factors, including:
- emotionally charged or provocative framing that increases user interaction
- platform algorithms that prioritize engaging content
- community-specific dynamics across different social media platforms
Polarization and narrative alignment
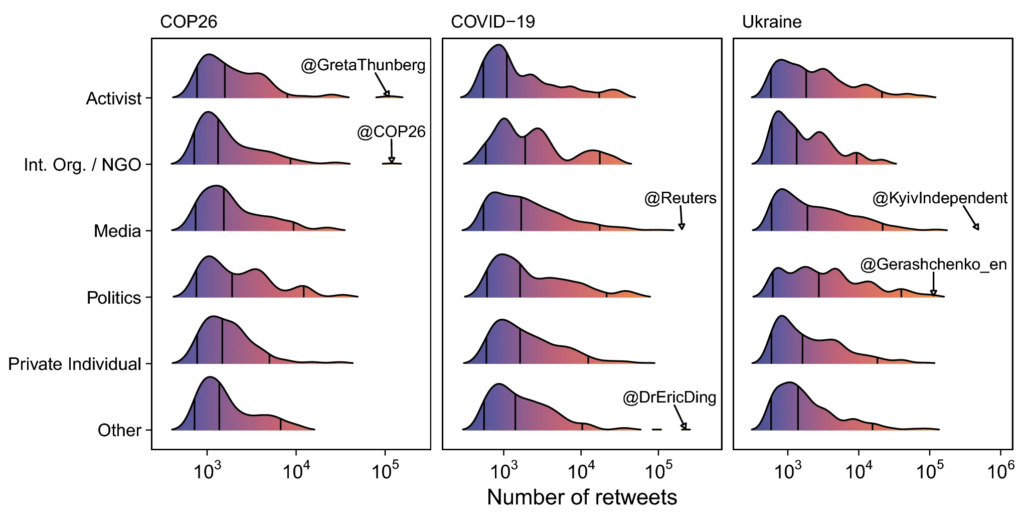
The platform analyzes large-scale retweet networks to understand how online communities form and interact across major global debates, including climate change (COP26), COVID-19, and the Russo-Ukrainian war.
Decentralized engagement
Across topics, attention is distributed across multiple types of actors, such as activists, organizations, media outlets, politicians, and private individuals. No single category consistently dominates engagement. Instead, visibility emerges from how strongly an actor’s content resonates with the audience.
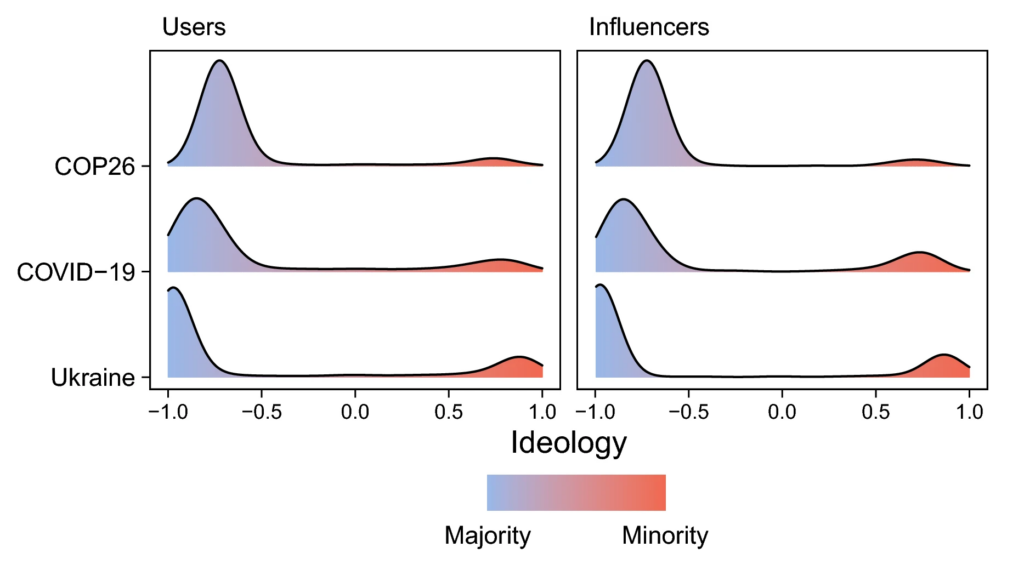
Ideological polarization
Network analysis reveals a strongly bimodal ideological structure (two groups: 🔵 Majority and 🔴 Minority).
Users and influencers both cluster the same way, into two largely separated communities, reflecting contrasting narrative alignments. Interaction patterns indicate that users predominantly engage with accounts that share their ideological position.
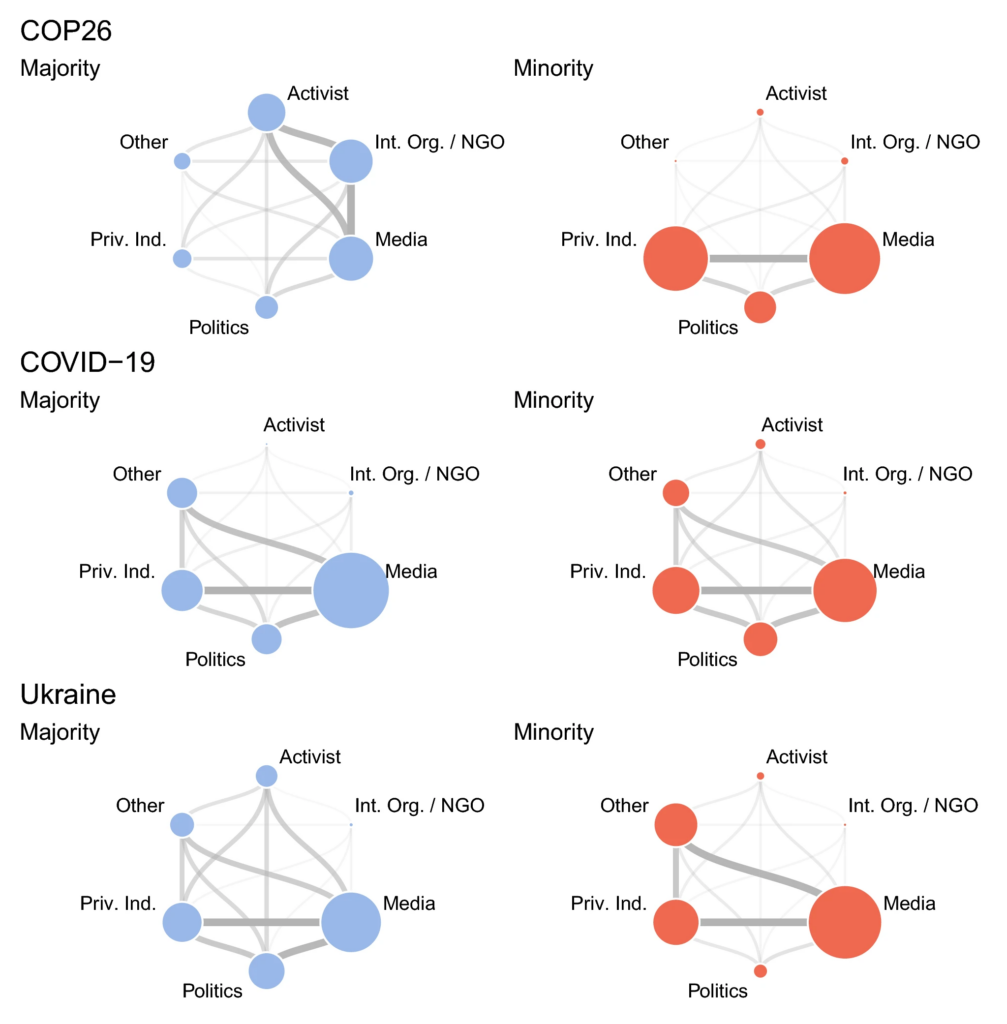
Distinct information ecosystems
These polarized communities also rely on different sources of information. The groups amplify different categories of influencers, reinforcing selective exposure and the persistence of echo-chamber dynamics.
Importantly, these patterns extend across multiple debates. Users who cluster together in one topic frequently appear within the same ideological communities in other discussions, suggesting that online polarization reflects broader and persistent alignment patterns rather than isolated disagreements.
References
musma-monitoring-platform, GitHub Code Repository. URL: https://github.com/beatrice-portelli/musma-monitoring-platform
[Storani25] Storani, S., Falkenberg, M., Quattrociocchi, W., & Cinelli, M. (2025). Relative engagement with sources of climate misinformation is growing across social media platforms. Scientific Reports, 15(1), 18629. DOI: https://doi.org/10.1038/s41598-025-03082-9
[Loru25] Loru, E., Di Marco, N., Cinelli, M., & Quattrociocchi, W. (2025). A Compression-Based Approach to Detecting Automated and Coordinated Behavior on Social Media. ACM Transactions on Knowledge Discovery from Data. DOI: https://doi.org/10.1145/3778356